
- Moving the markets
The never-ending stimulus saga continued to govern the headlines, as artful rhetoric by skilled politicians kept the hope alive that a compromise will still be a possibility—soon.
Posted CNBC:
Pelosi said Thursday a deal on new coronavirus aid was “just about there.” She also said: “If we were not making progress, I wouldn’t spend five seconds in these conversations. … This is not anything other than I think a serious attempt. I do believe that both sides want to reach an agreement.”
To be sure, Pelosi noted that both sides have yet to reach an agreement on certain key issues, including state and local funding. She also cautioned it could take “a while” for lawmakers to actually write and vote on any aid bill.
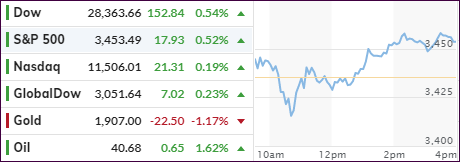
That was enough to pull the indexes out of their mid-day doldrums, and all closed moderately to the upside. GLD was the odd man out, as a sudden rally in the for dead declared US dollar pushed the precious back down towards its hard-fought for $1,900 level. The drop was further aided by higher bond yields.
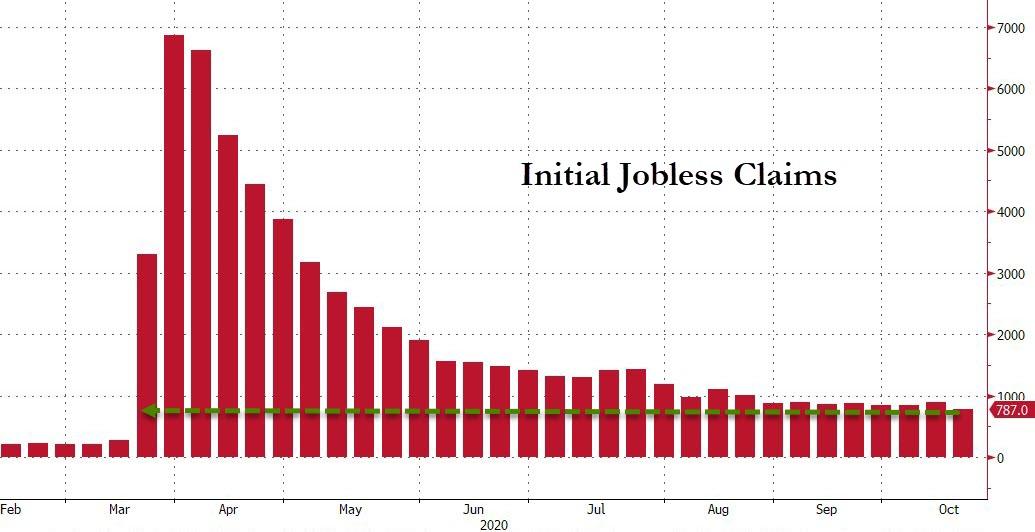
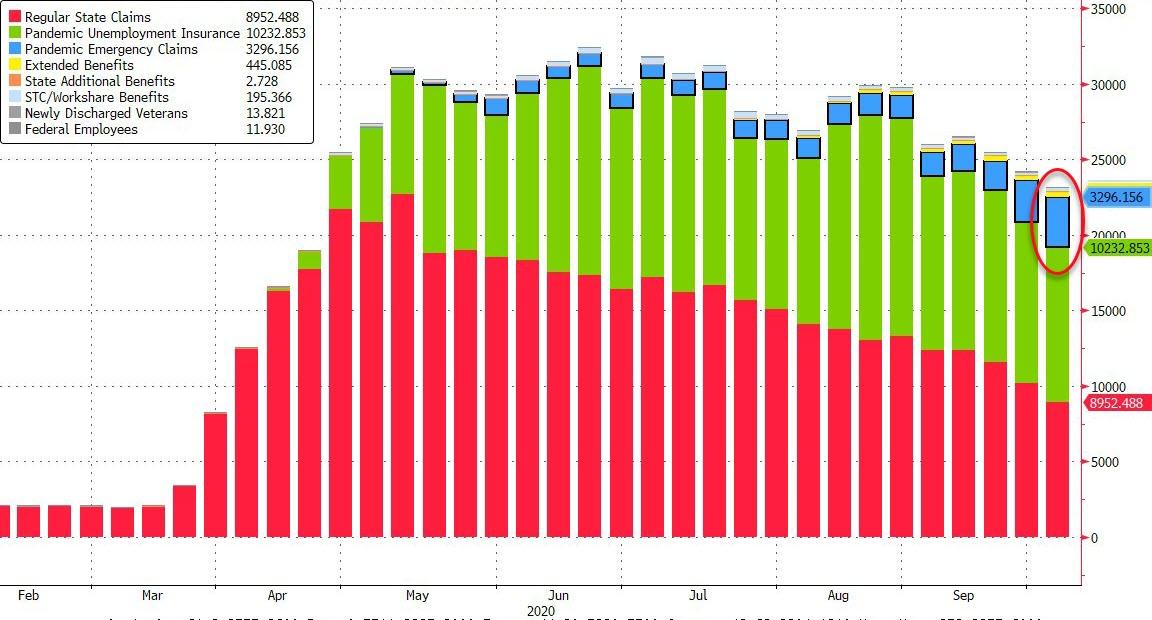
On the economic front, we learned that Existing Home Sales soared to their highest since 2006, according to ZH, scoring a gain of 9.4% MoM in September vs. a 5% expectation. Initial Jobless claims dipped a little from last week, registering 787k vs. 870k expected, but the Pandemic Emergency Claims number soared, as Bloomberg shows here.
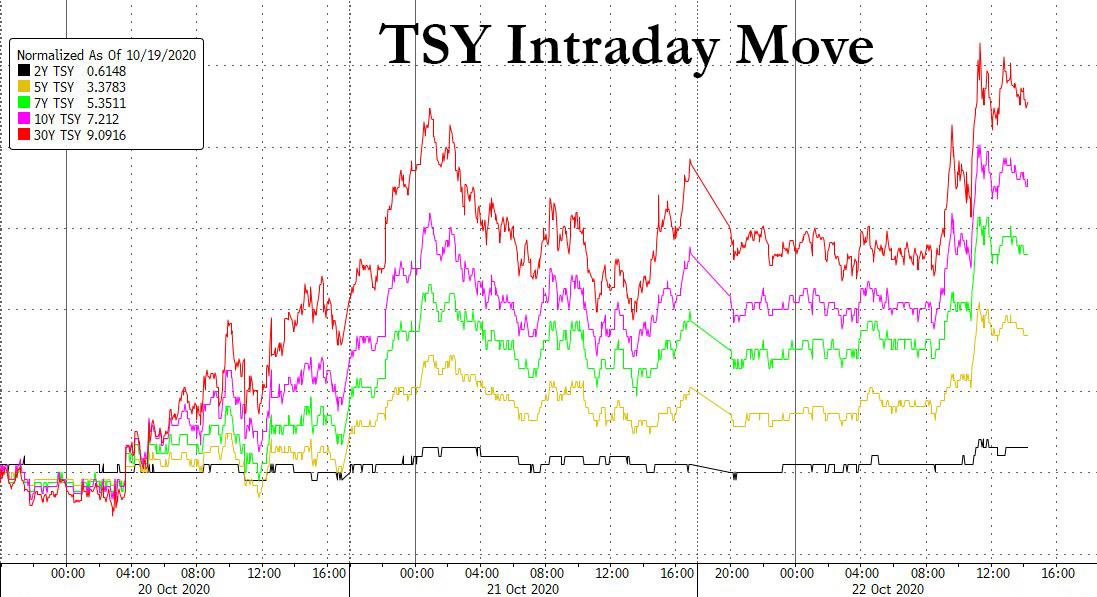
Concerning for the bulls could be the broad push higher to across the Treasury yield spectrum with the 10-year rising to 0.85% early in the session. Remember that higher yields tend to be bull market killers.
On deck is the biggest event in 4 years, when “The Debate #2” is scheduled to take place. For sure, as last time, I don’t expect real issues to be discussed, but no matter how this sparring match ends, the markets will be affected.
2. ETFs in the Spotlight
In case you missed the announcement and description of this section, you can read it here again.
It features some of the 10 broadly diversified domestic and sector ETFs from my HighVolume list as posted every Saturday. Furthermore, they are screened for the lowest MaxDD% number meaning they have been showing better resistance to temporary sell offs than all others over the past year.
The below table simply demonstrates the magnitude with which these ETFs are fluctuating above or below their respective individual trend lines (%+/-M/A). A break below, represented by a negative number, shows weakness, while a break above, represented by a positive percentage, shows strength.
For hundreds of ETF choices, be sure to reference Thursday’s StatSheet.
For this current domestic “Buy” cycle, here’s how some our candidates have fared:
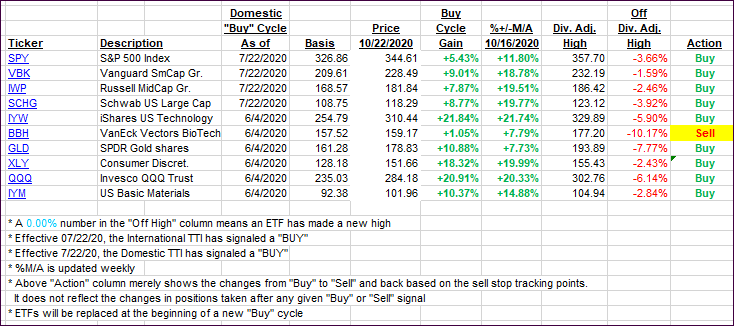
Click image to enlarge
Again, the %+/-M/A column above shows the position of the various ETFs in relation to their respective long-term trend lines, while the trailing sell stops are being tracked in the “Off High” column. The “Action” column will signal a “Sell” once the -8% point has been taken out in the “Off High” column. For more volatile sector ETFs, the trigger point is -10%.
3. Trend Tracking Indexes (TTIs)
Our TTIs advanced with especially the Domestic one jumping due to today’s comeback rally being broad based.
This is how we closed 10/22/2020:
Domestic TTI: +11.02% above its M/A (prior close +9.62%)—Buy signal effective 07/22/2020
International TTI: +6.60% above its M/A (prior close +6.27%)—Buy signal effective 07/22/2020
Disclosure: I am obliged to inform you that I, as well as my advisory clients, own some of the ETFs listed in the above table. Furthermore, they do not represent a specific investment recommendation for you, they merely show which ETFs from the universe I track are falling within the specified guidelines.
Contact Ulli