- Moving the markets
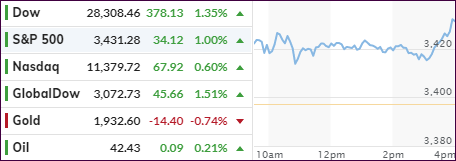
At least for this session, we saw a change in leadership with the Dow racing ahead +1.35% leaving the S&P 500 trailing with only a +1% gain. Lagging the major indexes, despite an early solid jump, was the Nasdaq, which dropped into the red at one point but managed to eke out a relatively meager +0.60%.
Gold fell early on, rallied sharply back above its unchanged line but sold off in the end failing again to reclaim its magic $2k level.
The upbeat mood was the result of renewed hopes for a Covid-19 treatment, after the FDA said “it approved the use of convalescent plasma, the antibody-rich component of blood taken from recovered Covid-19 patients, as a treatment for serious coronavirus cases.”
Commented MarketWatch:
The new bout of optimism helped beaten-down cyclical sectors, including shares of energy and industrials, areas that would benefit from a faster economic rebound. Energy shares led the S&P 500’s gains in afternoon trade.
Taking front and center this week will be the Kansas City Federal Reserve Bank’s annual symposium. The event is usually held in Jackson Hole, WY, but it will be conducted via webcast this year. Fed chair Powell is scheduled to speak Thursday on “how the central bank plans to achieve its twin goals of stable prices and maximum employment once the coronavirus pandemic has ended.”
The symposium’s title for this year is “Navigating the Decade Ahead: Implications for Monetary Policy,” which left Bloomberg’s Richard Breslow somewhat dumbfounded:
I have to admit, that leaves me cold and, somewhat worryingly, uninterested. To think they know anything about the decade ahead, let alone intend to act upon any conclusions based on the forecasts, seems devoid of any ideas to do something about the here and now.
Again, today’s advance lacked “breadth,” which has created a lack of correlation, as Bloomberg points to in this chart. While such divergences can last a while, sooner or later a recoupling is in order.
There is no guesswork here; we need to wait and observe how it plays out to see if the major bullish trend gets interrupted to a point that would trigger our exit strategy.
2. ETFs in the Spotlight
In case you missed the announcement and description of this section, you can read it here again.
It features some of the 10 broadly diversified domestic and sector ETFs from my HighVolume list as posted every Saturday. Furthermore, they are screened for the lowest MaxDD% number meaning they have been showing better resistance to temporary sell offs than all others over the past year.
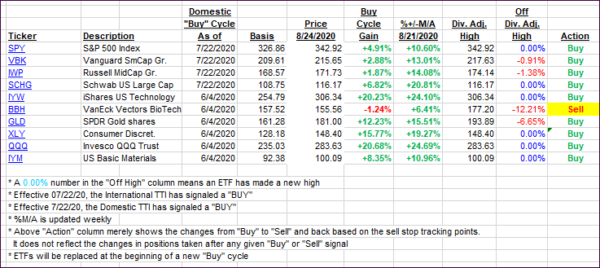
The below table simply demonstrates the magnitude with which these ETFs are fluctuating above or below their respective individual trend lines (%+/-M/A). A break below, represented by a negative number, shows weakness, while a break above, represented by a positive percentage, shows strength.
For hundreds of ETF choices, be sure to reference Thursday’s StatSheet.
For this current domestic “Buy” cycle, here’s how some our candidates have fared:

Click image to enlarge
Again, the %+/-M/A column above shows the position of the various ETFs in relation to their respective long-term trend lines, while the trailing sell stops are being tracked in the “Off High” column. The “Action” column will signal a “Sell” once the -8% point has been taken out in the “Off High” column. For more volatile sector ETFs, the trigger point is -10%.
3. Trend Tracking Indexes (TTIs)
Our TTIs jumped and moved deeper into bullish territory.
This is how we closed 08/24/2020:
Domestic TTI: +7.51% above its M/A (prior close +5.78%)—Buy signal effective 07/22/2020
International TTI: +5.80% above its M/A (prior close +4.27%)—Buy signal effective 07/22/2020
Disclosure: I am obliged to inform you that I, as well as my advisory clients, own some of the ETFs listed in the above table. Furthermore, they do not represent a specific investment recommendation for you, they merely show which ETFs from the universe I track are falling within the specified guidelines.
Contact Ulli