
- Moving the markets
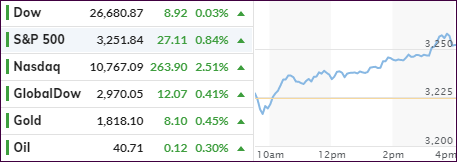
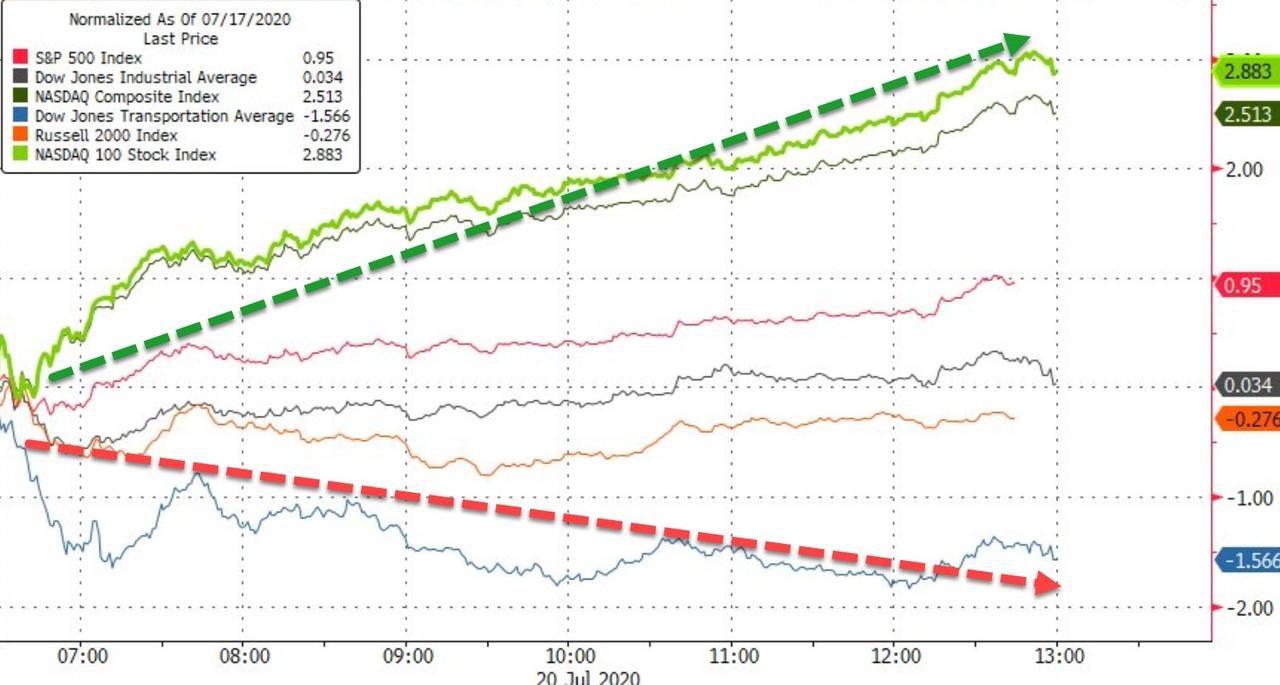
Right after the opening bell, the Nasdaq took over and lead the major indexes via a steady ramp to a green close. The Dow barely closed to the upside, while the S&P 500 showed a decent increase, but that one paled compared to the tech sector’s chest pounding 2.51% surge.
Much of this was based on anticipated earnings during this week, somewhat helped by positive developments from vaccine candidates but overshadowed by coronavirus cases and deaths continuing to set records.
North Carolina, Louisiana, and Kentucky reported record infections of COVID-19 of 2,400, 3,119 and 979 respectively on Sunday, The Wall Street Journal reported, while Arizona registered a record high death tally of 147 deaths.
Meanwhile, Florida, the epicenter of the outbreak in the U.S., reported nearly seven-day average of 12,000 cases, surging by nearly a 30%, according to CNBC, citing data compiled by Johns Hopkins University.
However, this week will be all about earnings and how many companies can beat the sharply reduced expectations, despite realization setting in that the dream of a V-shape type of recovery may be exactly that—a dream. The question remains as to whether the “improved” earnings will be in line with what markets expect, or will they provide a dose of reality?
Added MarketWatch:
Although Wall Street is betting that earnings will start bouncing off the bottom in the third quarter, the beginning point for that bounce is unknown, and early indications suggest the rebound’s magnitude may not match investors’ hopes.
Today has sent Bloomberg’s Fear-Greed index to its highest ever—above March 2000’s previous peak, according to ZH:
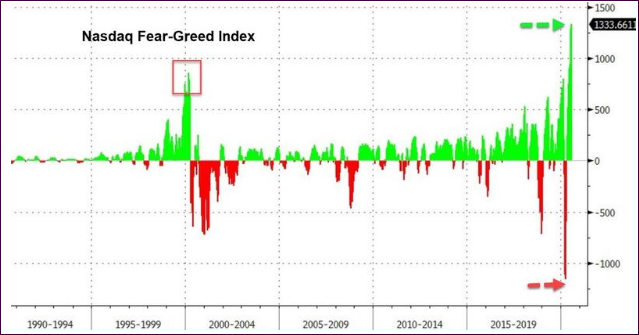
The lesson is simple. You cannot be in this market without an exit strategy.
2. ETFs in the Spotlight
In case you missed the announcement and description of this section, you can read it here again.
It features some of the 10 broadly diversified domestic and sector ETFs from my HighVolume list as posted every Saturday. Furthermore, they are screened for the lowest MaxDD% number meaning they have been showing better resistance to temporary sell offs than all others over the past year.
The below table simply demonstrates the magnitude with which these ETFs are fluctuating above or below their respective individual trend lines (%+/-M/A). A break below, represented by a negative number, shows weakness, while a break above, represented by a positive percentage, shows strength.
For hundreds of ETF choices, be sure to reference Thursday’s StatSheet.
For this new domestic “Buy” cycle, which ended effective 6/25/2020, here’s how some our candidates have fared:
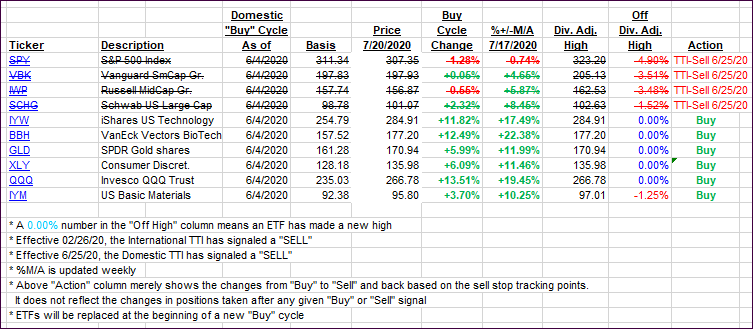
Click image to enlarge
Again, the %+/-M/A column above shows the position of the various ETFs in relation to their respective long-term trend lines, while the trailing sell stops are being tracked in the “Off High” column. The “Action” column will signal a “Sell” once the -8% point has been taken out in the “Off High” column. For more volatile sector ETFs, the trigger point is -10%.
3. Trend Tracking Indexes (TTIs)
Our TTIs were mixed with the international one gaining and the domestic one losing, the cause of which was a narrowly defined advance with not much broad participation.
This is how we closed 07/20/2020:
Domestic TTI: +1.84% above its M/A (prior close +2.38%)—Sell signal effective 06/25/2020
International TTI: +1.64% above its M/A (prior close +1.29%)—Sell signal effective 02/26/2020
Disclosure: I am obliged to inform you that I, as well as my advisory clients, own some of the ETFs listed in the above table. Furthermore, they do not represent a specific investment recommendation for you, they merely show which ETFs from the universe I track are falling within the specified guidelines.
Contact Ulli