
- Moving the markets
The markets did not show us a rebound this morning, so the Domestic “Sell” signal stands—at least for the time being.
We’re living in such uncertain times, that we can never be sure, nor does anybody know, if this was just one more head fake or the beginning of another devastating down trend, that could take out the March lows.
As a result, we are going the safe route and follow our signals. Some analysts contribute this week’s sell-off to quarter-ending rebalancing, but that is nothing but a guess.
Should the bullish theme prevail via another rally next week, we will pick a new entry point in accordance with our Trend Tracking Index. I believe in this environment of total uncertainty it is better to be safe than sorry, however, we will hang on to our current gold/sector positions subject to their respective trailing sell stops.
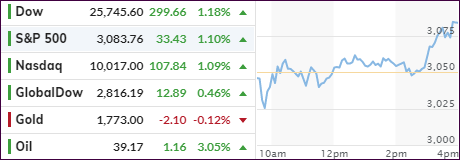
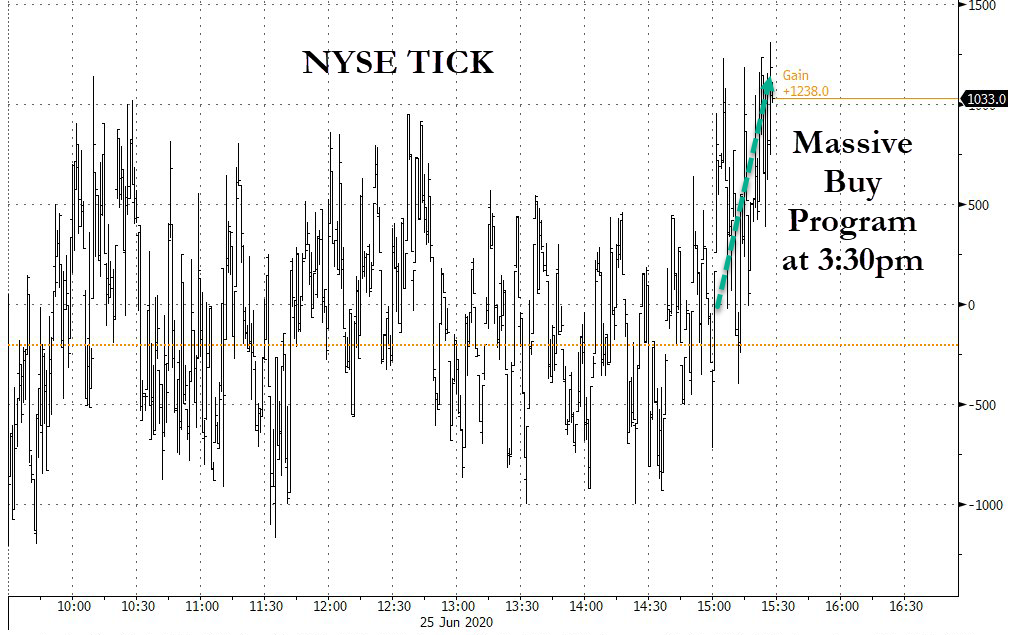
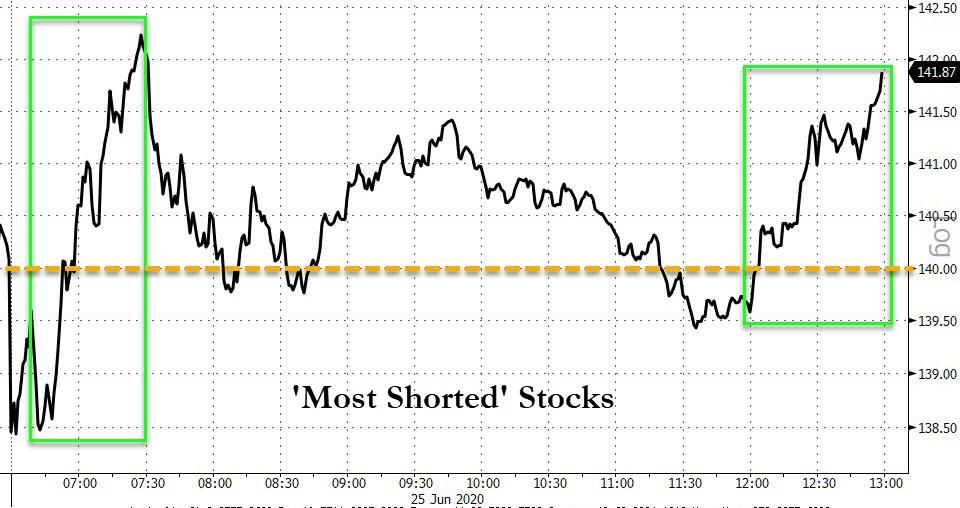
An early 200-point Dow drop was recouped with the indexes mainly vacillating around their unchanged lines in a tight range until, during the last 30 minute of the session, a massive Buy program kicked in and ignited a spectacular short-squeeze, which lifted the major indexes solidly in the green.
Reader Gary suggested that “you can’t fight the Fed plus we are going into election. The market is being controlled by the government so normal movement is gone.”
This is correct, but you also must consider that there are opposing forces that want to make sure at all costs that the incumbent President will not be re-elected. That means we are engaged in a tug-of-war with the outcome being impossible to predict.
I follow our TTI signals, because I don’t mind erring on the side of caution, which is far better than going down with a sinking ship—just because it wasn’t supposed to be sinking.
2. ETFs in the Spotlight
In case you missed the announcement and description of this section, you can read it here again.
It features some of the 10 broadly diversified domestic and sector ETFs from my HighVolume list as posted every Saturday. Furthermore, they are screened for the lowest MaxDD% number meaning they have been showing better resistance to temporary sell offs than all others over the past year.
The below table simply demonstrates the magnitude with which these ETFs are fluctuating above or below their respective individual trend lines (%+/-M/A). A break below, represented by a negative number, shows weakness, while a break above, represented by a positive percentage, shows strength.
For hundreds of ETF choices, be sure to reference Thursday’s StatSheet.
For this new domestic “Buy” cycle, which ended effective 6/25/2020, here’s how some our candidates have fared:
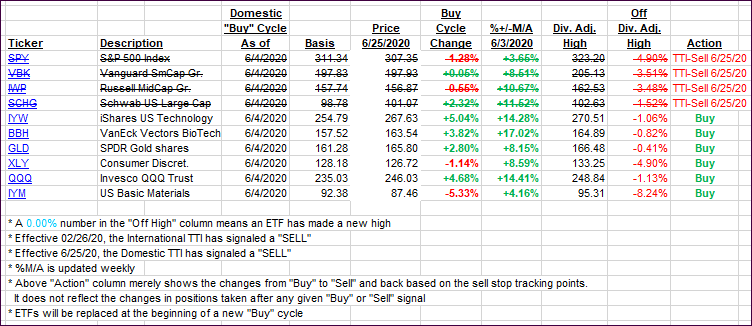
Click image to enlarge
Again, the %+/-M/A column above shows the position of the various ETFs in relation to their respective long-term trend lines, while the trailing sell stops are being tracked in the “Off High” column. The “Action” column will signal a “Sell” once the -8% point has been taken out in the “Off High” column. For more volatile sector ETFs, the trigger point is -10%.
3. Trend Tracking Indexes (TTIs)
Our TTIs recovered some as, after an early 200-point dump, the markets were pushed higher in the last 30 minutes, with a massive Buy program assisting the bulls.
This is how we closed 06/25/2020:
Domestic TTI: -3.51% below its M/A (prior close -4.48%)—Sell signal effective 06/25/2020
International TTI: -4.10% below its M/A (prior close -4.63%)—Sell signal effective 02/26/2020
Disclosure: I am obliged to inform you that I, as well as my advisory clients, own some of the ETFs listed in the above table. Furthermore, they do not represent a specific investment recommendation for you, they merely show which ETFs from the universe I track are falling within the specified guidelines.
Contact Ulli