
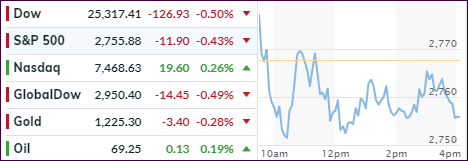
- Moving the markets
We saw another see-saw ride on Wall Street with bulls and bears engaging in a continuous battle for domination. There were no clear winners and some of the intra-day rally attempts fell short of pushing the major indexes above their respective unchanged lines. The exception was the Nasdaq, which managed to eke out a small gain, while the S&P 500 scored its 4th straight loss.
So, the tug-of-war continued, but I took the opportunity to lighten up some more on our few remaining positions, as both of our Trend Tracking Indexes (TTIs) headed deeper into bearish territory with the Domestic one now closing in on a level that requires an all-cash position regarding “broadly diversified domestic ETFs.”
We are at an inflection point where the markets can still break out either way. The only bullish component I currently see is the upcoming earnings season, which could provide a boost to the markets leaving open the question as to whether this would only be of a short-term nature or have enough strength to get our Domestic TTI back on the bullish side of the trend line.
In the meantime, this current choppiness may stay with us until a breakout occurs, either to the downside or to the upside. Right now, downside momentum seems to have the upper hand as my indicators show, along with the US Financial Conditions Index.
- ETFs in the Spotlight
In case you missed the announcement and description of this section, you can read it here again.
It features 10 broadly diversified and sector ETFs from my HighVolume list as posted every Saturday. Furthermore, they are screened for the lowest MaxDD% number meaning they have been showing better resistance to temporary sell offs than all others over the past year.
The below table simply demonstrates the magnitude with which some of the ETFs are fluctuating regarding their positions above or below their respective individual trend lines (%M/A). A break below, represented by a negative number, shows weakness, while a break above, represented by a positive percentage, shows strength.
For hundreds of ETF choices, be sure to reference Thursday’s StatSheet.
Year to date, here’s how our candidates have fared so far:
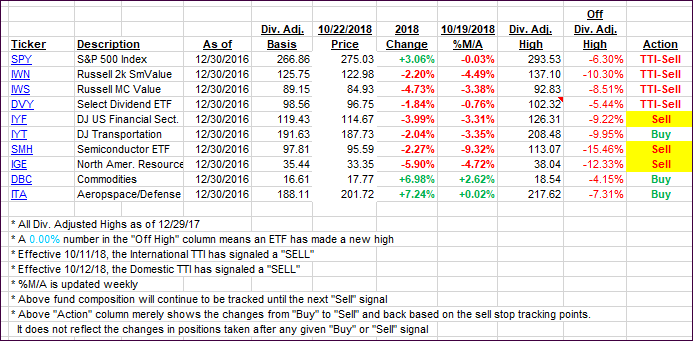
Again, the %M/A column above shows the position of the various ETFs in relation to their respective long-term trend lines, while the trailing sell stops are being tracked in the “Off High” column. The “Action” column will signal a “Sell” once the -8% point has been taken out in the “Off High” column. For more volatile sector ETFs, the trigger point is -10%.
- Trend Tracking Indexes (TTIs)
Our Trend Tracking Indexes (TTIs) dipped deeper below their trend lines. as todays’ session turned into see-saw Monday.
Here’s how we closed 10/22/2018:
Domestic TTI: -2.10% below its M/A (last close -1.45%)—Sell signal effective 10/12/2018
International TTI: -3.85% below its M/A (last close -3.36%)—Sell signal effective 10/11/2018
Disclosure: I am obliged to inform you that I, as well as my advisory clients, own some of the ETFs listed in the above table. Furthermore, they do not represent a specific investment recommendation for you, they merely show which ETFs from the universe I track are falling within the guidelines specified.
Contact Ulli