- Moving the markets
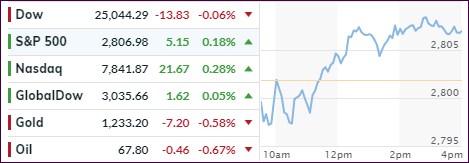
The tech and banking sector combined forces to put a floor under an early slide that helped the S&P 500 and Nasdaq to modest gains, but the Dow fell short of reaching the unchanged line by -0.06%, as 3M proved to be the baggage by sliding -1.5%.
While trade war rhetoric with China was noticeably absent, the warring factions simply changed, as Trump now traded barbs on Twitter Sunday evening with Iranian President Rouhani regarding alleged hostilities. That certainly did not give Wall Street traders the warm fuzzies and markets meandered for a while before settling down and cutting early losses.
At the same time, finance ministers and central bankers from the G20 had nothing to show for after a weekend meeting in Buenos Aires on trade tensions. That event reminded me of a tug-of-war with both parties digging in but neither one managing to get control of the rope.
As noted last week, earnings season will be kicking into high gear over the next few trading sessions. So far, earnings are up 21% this quarter, which is supposed to be a floor for further stock market advances. Of course, economic data points will have an influence as well and today’s existing home sales were anything but awe inspiring, as they suffered their worst losing streak since 2014. In June, they tumbled 0.6% MoM vs expectations of a 0.2% rise. Ouch!
Interest rates spiked with the 10-year yield jumping 7 basis points to 2.96%, its highest level in 5 weeks. That brings a total different meaning to my favorite chart in that the 30-year yield has now caught up to the level of the Nasdaq, when it would have been more likely for the Nasdaq to catch down to the level of the yield.
That simply goes to show that you can never be too certain, but we’ll have to wait and see if those two remain in sync or if this was just an aberration.
- ETFs in the Spotlight
In case you missed the announcement and description of this section, you can read it here again.
It features 10 broadly diversified and sector ETFs from my HighVolume list as posted every Saturday. Furthermore, they are screened for the lowest MaxDD% number meaning they have been showing better resistance to temporary sell offs than all others over the past year.
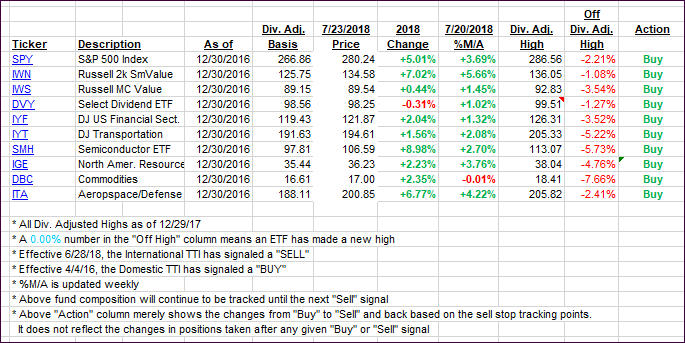
The below table simply demonstrates the magnitude with which some of the ETFs are fluctuating regarding their positions above or below their respective individual trend lines (%M/A). A break below, represented by a negative number, shows weakness, while a break above, represented by a positive percentage, shows strength.
For hundreds of ETF choices, be sure to reference Thursday’s StatSheet.
Year to date, here’s how our candidates have fared so far:
 Again, the %M/A column above shows the position of the various ETFs in relation to their respective long-term trend lines, while the trailing sell stops are being tracked in the “Off High” column. The “Action” column will signal a “Sell” once the -8% point has been taken out in the “Off High” column. For more volatile sector ETFs, the trigger point is -10%.
- Trend Tracking Indexes (TTIs)
Our Trend Tracking Indexes (TTIs) were mixed again. The Domestic one edged higher, while the International one slipped keeping us in a neutral position and waiting to see if a new “Buy” will be confirmed.
Here’s how we closed 07/23/2018:
Domestic TTI: +2.74% above its M/A (last close +2.70%)—Buy signal effective 4/4/2016
International TTI: +0.39% above its M/A (last close +0.61%)—Sell signal effective 6/28/2018
Disclosure: I am obliged to inform you that I, as well as my advisory clients, own some of the ETFs listed in the above table. Furthermore, they do not represent a specific investment recommendation for you, they merely show which ETFs from the universe I track are falling within the guidelines specified.
Contact Ulli
