
- Moving the markets
As I mentioned yesterday, volatility (VIX above 35) and rising bond yields, which spiked during a weak auction and spooked equities, combined to give the bears the upper hand as the major indexes fell off a cliff with the Dow entering correction territory. ZH summed it up perfectly:
As a reminder, the ‘good’ news of a budget deal and no government shutdown means higher deficits and more Treasury supply, and with The Fed out of the bond-buying game, the search for the marginal buyer continues to push rates higher.
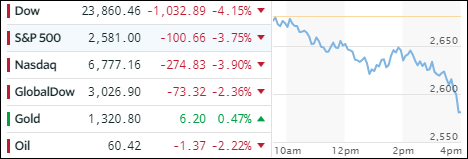
10% Correction Levels:
- Dow 23954 – Dow closed at 23860 is in correction
- S&P 2585 – S&P closed at 2581 in correction
- Nasdaq 6755 – Nasdaq closed at 6777, not in correction
Needless to say, there were no green numbers to be found, and there was no place to hide. The markets may remain volatile, as long as the upward pressure on bond yields does not subside. The 10-year yield rose only 1 basis point to 2.85% but the fear of potentially more upward momentum is what keeps the markets from stabilizing.
Our Trend Tracking Indexes (TTIs) dropped sharply (see section 3) and are barely staying above their respective trend lines. Additionally, most holdings are dancing around their sell stops and will be liquidated tomorrow, unless I see some market stability or a rebound, in which case I will hold off another day. A slip into bear market territory is now a distinct possibility.
- ETFs in the Spotlight
In case you missed the announcement and description of this section, you can read it here again.
It features 10 broadly diversified and sector ETFs from my HighVolume list as posted every Saturday. Furthermore, they are screened for the lowest MaxDD% number meaning they have been showing better resistance to temporary sell offs than all others over the past year.
The below table simply demonstrates the magnitude with which some of the ETFs are fluctuating in regards to their positions above or below their respective individual trend lines (%M/A). A break below, represented by a negative number, shows weakness, while a break above, represented by a positive percentage, shows strength.
For hundreds of ETF choices, be sure to reference Thursday’s StatSheet.
Year to date, here’s how our candidates have fared so far:
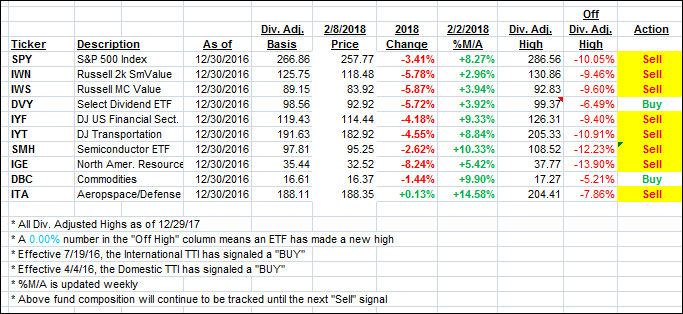
Again, the %M/A column above shows the position of the various ETFs in relation to their respective long term trend lines, while the trailing sell stops are being tracked in the “Off High” column. The “Action” column will signal a “Sell” once the -7.5% point has been taken out in the “Off High” column.
- Trend Tracking Indexes (TTIs)
Our Trend Tracking Indexes (TTIs) went south as the major indexes took a dive into the close.
Here’s how we closed 2/8/2018:
Domestic TTI: +1.00% above its M/A (last close +2.44%)—Buy signal effective 4/4/2016
International TTI: +0.83% above its M/A (last close +3.25%)—Buy signal effective 7/19/2016
Disclosure: I am obliged to inform you that I, as well as my advisory clients, own some of the ETFs listed in the above table. Furthermore, they do not represent a specific investment recommendation for you, they merely show which ETFs from the universe I track are falling within the guidelines specified.
Contact Ulli