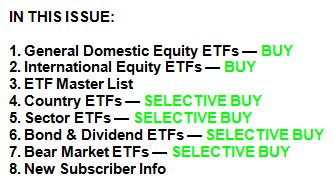
ETF Data updated through Thursday, August 3, 2017
Methodology/Use of this StatSheet:
- From the universe of over 1,800 ETFs, I have selected only those with a trading volume of over $5 million per day (HV ETFs), so that liquidity and a small bid/ask spread are assured.
- Trend Tracking Indexes (TTIs)
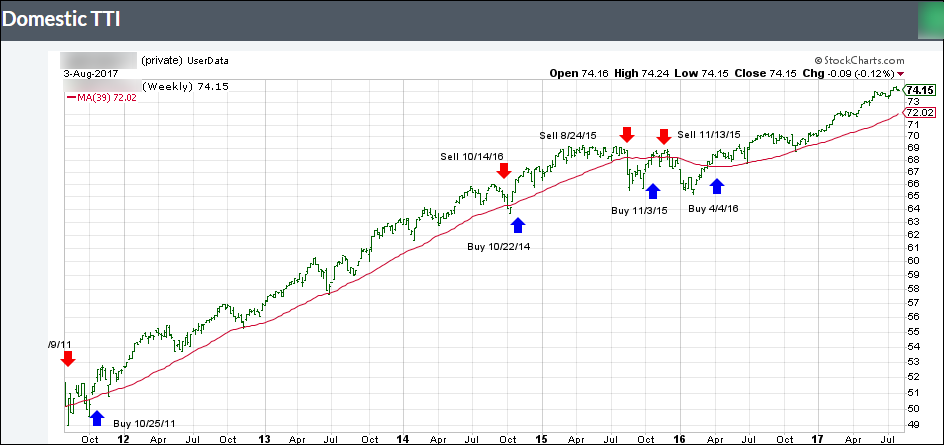
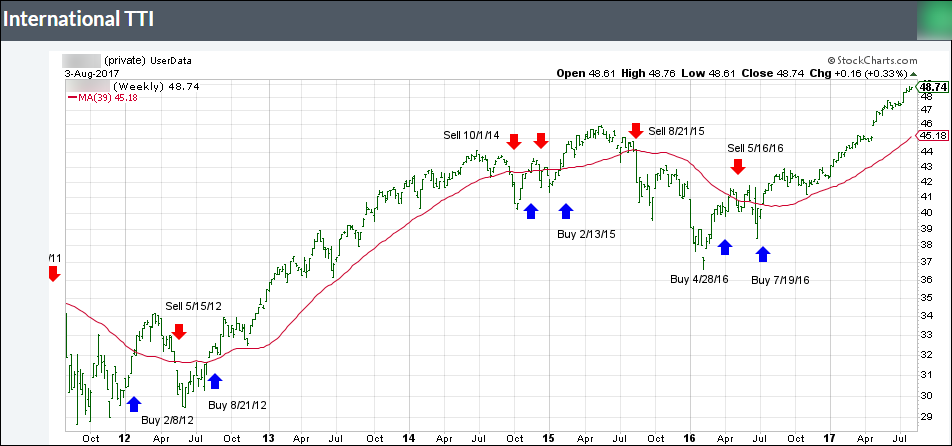
Buy or Sell decisions for Domestic and International ETFs (section 1 and 2), are made based on the respective TTI and its position either above or below its long-term M/A (Moving Average). A crossing of the trend line from below accompanied by some staying power above constitutes a “Buy” signal. Conversely, a clear break below the line constitutes a “Sell” signal. Additionally, I use a 7.5% trailing stop loss on all positions in these categories to control downside risk.
- All other investment arenas do not have a TTI and should be traded based on the position of the individual ETF relative to its own respective trend line (%M/A). That’s why those signals are referred to as a “Selective Buy.” In other words, if an ETF crosses its own trendline to the upside, a “Buy” signal is generated. Since these areas tend to be more volatile, I recommend a wider trailing sell stop of 7.5% -10% depending on your risk tolerance.
If you are unfamiliar with some of the terminology, please see Glossary of Terms and new subscriber information in section 9.
- DOMESTIC EQUITY ETFs: BUY — since 4/4/2016
Our main directional indicator, the Domestic Trend Tracking Index (TTI-green line in the above chart) is positioned above its long-term trend line (red) by +3.16% after having generated a new Domestic Buy signal effective 4/4/2016 as posted.
The link below shows all High Volume (HV) Domestic Equity ETFs. The sorting order is by M-Index ranking. Prices in all linked tables below are updated through 08/03/2017, unless otherwise noted. Price data not yet available at publication is indicated with 00.00% or -100.00%. Please note that distributions are not included in the current momentum numbers.
Whenever the TTI is above the trend line, and therefore in “Buy” mode, you can either use the tables in the link below to make your selections or choose from the 10 ETFs in the Spotlight, which are featured daily as part of the market commentary:
http://www.successful-investment.com/SSTables/HVDomETFs080317.pdf
- INTERNATIONAL ETFs: BUY — since 7/19/2016
The International Trend Tracking Index (green) is now positioned +8.35% above its long-term trend line (red) after having generated a new “Buy” signal on 7/19/2016.
The listings in the link below represent the High Volume (HV) International ETFs I track to be used during a Buy cycle. They are sorted by M-Index ranking:
http://www.successful-investment.com/SSTables/HVInternETFs080317.pdf
- ETF MASTER LIST
This ETF Master list shows the total of all ETFs listed, which allows you to get a quick overview of leaders and laggards. The sorting order is by M-Index. Momentum figures for all ETFs are not adjusted for dividends.
http://www.successful-investment.com/SSTables/HVETFMaster080317.pdf
- COUNTRY ETFs: SELECTIVE BUY
The link below contains a list of HV ETFs for countries/regions, which I am tracking weekly. Please note that data in this table does not include adjustments due to distributions.
http://www.successful-investment.com/SSTables/HVCountryETFs080317.pdf
Country funds, especially over the past few years, have been volatile. So the use of a trailing stop loss (I use 10%) is imperative to protect your portfolio from severe downside moves.
- SECTOR ETFs: SELECTIVE BUY
To diversify our portfolios, we always need to look for different opportunities to invest our money. The table of HV Sector ETF listings in the following link covers a broad spectrum of possibilities. The sorting order is by M-Index:
http://www.successful-investment.com/SSTables/HVSectorETFs080317.pdf
Here too, I recommend the use of a 10% trailing stop loss to minimize the risk.
- BOND & DIVIDEND ETFs: SELECTIVE BUY
If you prefer using ETFs for the generation of income, here’s a list of bond and dividend paying ETFs. It’s important to first look at how these instruments have held up in terms of momentum figures. Then you should visit your favorite financial web site to examine yield and other details.
Please note that data in this table does not include adjustments due to distributions.
http://www.successful-investment.com/SSTables/HVBond_DivETFs080317.pdf
- BEAR MARKET ETFs: SELECTIVE BUY
Below are the most commonly available bear market ETFs and their momentum figures:
http://www.successful-investment.com/SSTables/HVBearETFs080317.pdf
Please note that some of the above funds try to outperform the index they are tied to by the percentage stated. While this can enhance your returns it can certainly accelerate your losses as well. No matter which way you choose, be sure to work with a trailing sell stop (I suggest 10%) and be aware that volatility will be your constant companion.
- NEW SUBSCRIBER INFORMATION
To get a head start on more successful investing, please click on:
http://www.successful-investment.com/SellStopDiscipline.pdf
In case you missed it, you can download my latest e-book “How to beat the S&P 500…with the S&P 500,” here. If you are investing your 401k and have to use mutual funds, I suggest you primarily stick with the S&P 500 as described in my book. Of course, you can always use the above tables to find sector or country ETFs to your liking and use the equivalent mutual funds as offered by your custodian.
Disclosure:
I am obliged to inform you that I, as well as my advisory clients, own some of the ETFs listed in the above table. Furthermore, they do not represent a specific investment recommendation for you, they merely show which ETFs from the universe I track are falling within the guidelines specified.
Contact Ulli


