1. Moving the Markets
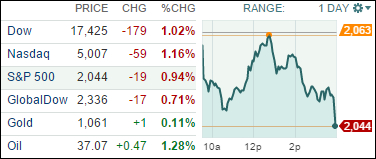
U.S. stocks closed out the final trading day of 2015 with both the Dow and S&P 500 suffering their first year of negative returns since 2008 when the financial crisis was in full swing. Both benchmarks were on the verge of a positive year at the start of today’s trading session, with the Dow needing a sizable, 219-point gain to hit break even. However, it wasn’t meant to be today, as all three major indexes fell about 1% or more and closed at their lows. The Nasdaq reigned supreme for 2015, posting final annual gains of 5.7%, while the S&P 500 and Dow ended the year down about 1%. Oil was by far the biggest loser this year, with the price of U.S. Crude dropping a whopping 30.5%.
It’s been an up and down year on Wall Street. After hitting record highs in May, the stock market suffered its first correction, or drop of 10% or more, back in August. And while the market has rebounded from its summer lows, all three of the major U.S. indexes are still around 3% to 4% off their peaks.
Stocks have been held back throughout the year by uncertainty surrounding interest rate policy, as the Federal Reserve hiked borrowing costs earlier this month for the first time in nearly a decade. Stocks have also been hurt by slowing growth in China, the negative fallout on sales and earnings of U.S. multinationals due to a stronger dollar and the steep losses in the energy sector, which have sent the energy sector of the S&P 500 down almost 24% this year.
Geopolitical threats around the globe and resurgence in terror attacks in the later stages of 2015 have also weighed on investor sentiment. Stock valuations are also above historical averages following the stock market’s more than tripling in value off of the lows back in March 2009.
All of our 10 ETFs in the Spotlight joined the last hour sell-off and closed lower. Leading the charge to the downside was Consumer Staples (XLP) with -1.12% while the Mid-Cap Value (IWS) held up best with -0.72%.
2. ETFs in the Spotlight
In case you missed the announcement and description of this section, you can read it here again.
It features 10 broadly diversified ETFs from my HighVolume list as posted every Monday. Furthermore, they are screened for the lowest MaxDD% number meaning they have been showing better resistance to temporary sell offs than all others over the past year.
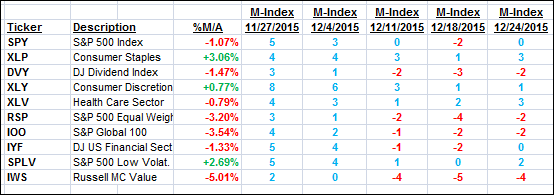
Here are the 10 candidates:

The above table simply demonstrates the magnitude with which some of the ETFs are fluctuating in regards to their positions above or below their respective individual trend lines (%M/A). A break below, represented by a negative number, shows weakness, while a break above, represented by a positive percentage, shows strength.
For hundreds of ETF/Mutual fund choices, be sure to reference Thursday’s StatSheet.
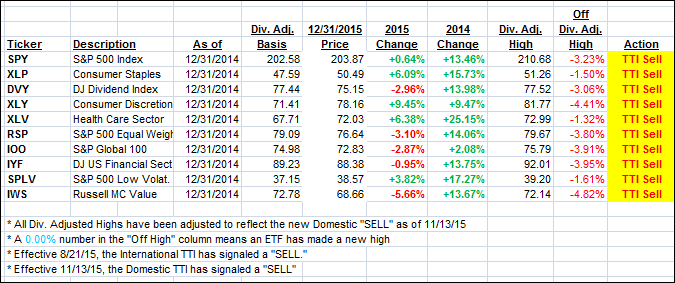
Year to date, here’s how the above candidates have fared so far:

Again, the first table above shows the position of the various ETFs in relation to their respective long term trend lines (%M/A), while the second one tracks their trailing sell stops in the “Off High” column. The “Action” column will signal a “Sell” once the -7.5% point has been taken out in the “Off High” column.
3. Trend Tracking Indexes (TTIs)
Our Domestic Trend Tracking Index (TTI) stumbled into the close as the major indexes ended 2015 on an ugly note by closing at their lows for the day. We’ve moved deeper into bear market territory and remain on the sidelines until a new “Buy” signal is being generated.
Here’s how we ended the year 2015:
Domestic TTI: -0.70% (last close -0.32%)—Sell signal effective 11/13/2015
International TTI: -4.28% (last close -3.71%)—Sell signal effective 8/21/2015
Disclosure: I am obliged to inform you that I, as well as advisory clients of mine, own some of these listed ETFs. Furthermore, they do not represent a specific investment recommendation for you, they merely show which ETFs from the universe I track are falling within the guidelines specified.
Contact Ulli