
1. Moving the Markets
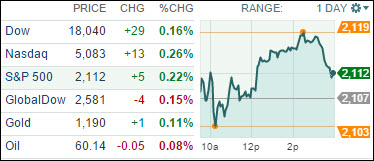
Stocks rose slightly as some improving economic data and a big tech deal helped Wall Street kick off the month of June on a positive note. Some M&A news gave markets a boost just before the opening bell when it was announced that Intel (INTC) said it will buy fellow chip maker Altera (ALTR) for $54 a share in an all-cash transaction valued at approximately $16.7 billion. The deal allows Intel to sell cheaper semi-custom made chips.
As for the economy, a batch of economic reports Monday showed that consumers were still pinching pennies even as the economy continued to emerge from a brutal winter. The data we saw today showed construction spending rising sharply and manufacturing activity expanding at a faster pace after a string of slowdowns. The hope was that the upturn would spill into more consumer-spending, but instead Americans are using their extra cash to pay down debt and fatten their bank accounts.
In commodities, crude oils rose to $62.15 a barrel in May, the first time the basket’s monthly price has topped $60 a barrel since last November. OPEC crude hit a low at less than $49 a barrel on March 17, and its most recent daily high was posted on May 6 at $64.96 a barrel.
It was a mixed bag today, as 8 of our 10 ETFs in the Spotlight headed higher, while 2 of them slipped and one ended unchanged. Healthcare (XLV) managed to take the lead on the upside with +0.40%; the Global 100 (IOO) slipped -0.32%.
2. ETFs in the Spotlight
In case you missed the announcement and description of this section, you can read it here again.
It features 10 broadly diversified ETFs from my HighVolume list as posted every Monday. Furthermore, they are screened for the lowest MaxDD% number meaning they have been showing better resistance to temporary sell offs than all others over the past year.
Here are the 10 candidates:
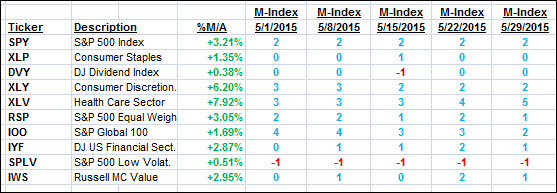
The above table simply demonstrates the magnitude with which some of the ETFs are fluctuating in regards to their positions above or below their respective individual trend lines (%M/A). A break below, represented by a negative number, shows weakness, while a break above, represented by a positive percentage, shows strength.
For hundreds of ETF/Mutual fund choices, be sure to reference Thursday’s StatSheet.
Year to date, here’s how the above candidates have fared so far:
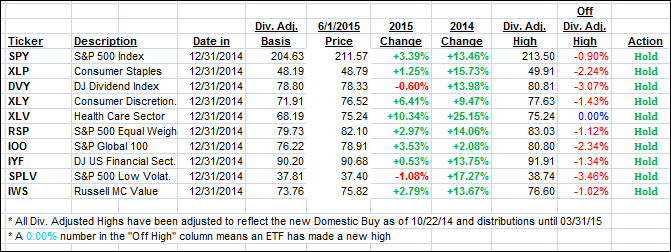
Again, the first table above shows the position of the various ETFs in relation to their respective long term trend lines (%M/A), while the second one tracks their trailing sell stops in the “Off High” column. The “Action” column will signal a “Sell” once the -7.5% point has been taken out in the “Off High” column.
3. Trend Tracking Indexes (TTIs)
Our Trend Tracking Indexes (TTIs) barely changed as there was no clear trend direction in today’s session. Here’s how we closed:
Domestic TTI: +2.28% (last close +2.27)—Buy signal effective 10/22/2014
International TTI: +3.93% (last close +4.07%)—Buy signal effective 2/13/2015
Disclosure: I am obliged to inform you that I, as well as advisory clients of mine, own some of these listed ETFs. Furthermore, they do not represent a specific investment recommendation for you, they merely show which ETFs from the universe I track are falling within the guidelines specified.
Contact Ulli