1. Moving the Markets
Markets shifted lower today amidst mixed domestic data, higher bond yields and (believe it or not) renewed concerns over Greece. After a myriad of budget cuts, a million lost jobs, 250,000 closed businesses and nearly 240 billion euros ($267 billion USD) in rescue loans, the country is once again on the brink of default and relations with its creditors are worse than ever.
Tech stocks took a hit today. Apple (AAPL), Microsoft (MSFT) and Google (GOOG) all declined. There was some interesting news though regarding Microsoft. We heard reports today that Microsoft is considering a bid for Salesforce.com, one week following a report the company was fielding bids for a potential takeover. The Salesforce stock (CRM) shot up 3.3% on the news, but did not comment on the rumors. Remember that Microsoft has already notched two major tech deal acquisitions of late. In September of 2013, the company announced it would acquire Nokia’s (NOK) handset business for $7 billion and last September, they scooped up the video game franchise Minecraft for $2.5 billion.
As for economic data, we heard today that the March trade deficit came in at $51.4 billion, which was far above expectations. Apparently, we just keep importing and the largest since 2008.
In earnings news, Walt Disney Co’s (DIS) quarterly revenue beat analysts’ expectations, helped by increased spending by visitors at its theme parks and strength in the company’s TV networks business. The company’s shares rose as much as 2% to a record high of $113.30. Tomorrow, we will hear from Keurig Green Mountain (GMCR), Tesla (TSLA) and a number of other market movers.
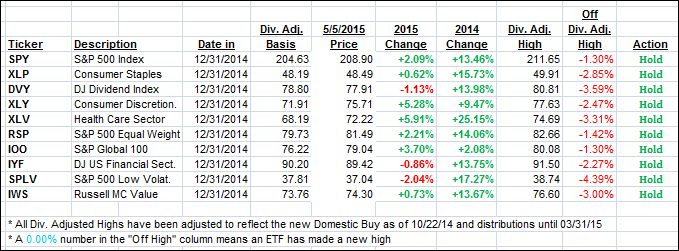
With the markets stuck on a black diamond slope today, it’s no surprise that all of our 10 ETFs in the Spotlight slumped and closed down. Leading to the downside was the Russell Mid-Cap Value (IWS) with a loss of 1.39%, while financials (IYF) held up the best by surrendering only 0.79%.
2. ETFs in the Spotlight
In case you missed the announcement and description of this section, you can read it here again.
It features 10 broadly diversified ETFs from my HighVolume list as posted every Monday. Furthermore, they are screened for the lowest MaxDD% number meaning they have been showing better resistance to temporary sell offs than all others over the past year.
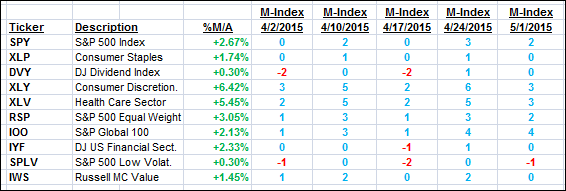
Here are the 10 candidates:
The above table simply demonstrates the magnitude with which some of the ETFs are fluctuating in regards to their positions above or below their respective individual trend lines (%M/A). A break below, represented by a negative number, shows weakness, while a break above, represented by a positive percentage, shows strength.
For hundreds of ETF/Mutual fund choices, be sure to reference Thursday’s StatSheet.
Year to date, here’s how the above candidates have fared so far:
Again, the first table above shows the position of the various ETFs in relation to their respective long term trend lines (%M/A), while the second one tracks their trailing sell stops in the “Off High” column. The “Action” column will signal a “Sell” once the -7.5% point has been taken out in the “Off High” column.
3. Trend Tracking Indexes (TTIs)
Our Trend Tracking Indexes (TTIs) weakenend as well but remain in bullish territory by the following percentages:
Domestic TTI: +2.00% (last close +2.60%)—Buy signal effective 10/22/2014
International TTI: +3.98% (last close +4.74%)—Buy signal effective 2/13/2015
Disclosure: I am obliged to inform you that I, as well as advisory clients of mine, own some of these listed ETFs. Furthermore, they do not represent a specific investment recommendation for you, they merely show which ETFs from the universe I track are falling within the guidelines specified.
Contact Ulli


