 I just found this story called “Utilities, REITs losing luster,” which features some of those sectors that have been the strong men over the past few years, but have lost their upside momentum.
I am talking about all REITs and Utilities; no matter whether you hold them as ETFS or no load funds. If you read my weekly StatSheet on a regular basis, you won’t need to wait for the newspaper headline to tell you which sectors are on the way down.
How?
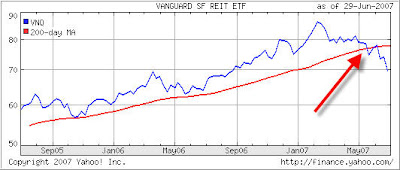
One of the columns in my StatSheet table is titled %M/A, which is the percentage a fund/ETF is above or below his long term trend line (moving average). Following this number every week, will give you a quick glimpse as to whether a fund is close to a trend reversal. We saw that with our REIT holding in March, when the trend was broken to the downside (and we sold our VNQ holdings) as the graph shows:
At that time, you were not reading any headline news about weakness in that sector. Remember, the news media tends to pounce on very obvious facts, not necessarily in a timely manner.
Utilities seem to be heading in the same direction, although the trend line has not been pierced yet, as I have been writing in recent weekly updates. We’re still holding our positions subject to our sell stop rules.
Next time, you’re unsure about where a fund is at in the bigger scheme of things, take a look at %M/A, or a graph at Yahoo or any other financial web site. The old axiom that a picture is worth a thousand words, certainly applies to trend tracking.
