
1. Moving the Markets
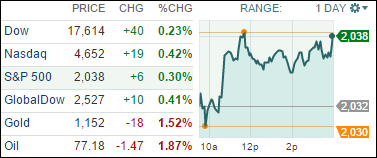
Well, the markets continue on their march up the mountain of gains as both the Dow and S&P 500 marked record highs again today. The U.S. economy continues to improve and corporations report better-than-expected earnings. Today, the S&P 500 gained 0.3%, the Dow rose 0.23% and the Nasdaq trumped all adding 0.42%.
In the world of retail, the third-quarter earnings season winds down, so retail earnings reports are in store from Macy’s, Walmart J.C. Penney and Nordstrom. With 90% of the S&P 500 companies reporting, 74.6% have posted earnings above Wall Street analysts’ expectations. That’s better than the average 63% of companies beating estimates in a typical quarter.
We heard big news from China today. China will launch its “Shanghai-Hong Kong Stock Connect” program. What is significant about this? Well, for the first time ever retail investors around the world will be able to invest in mainland Chinese equities, without a broker.
According to Goldman Sachs: “The new market essentially creates the world’s second-largest equity market by market cap,” second only to the New York Stock Exchange. Many market participants have said that the new system is also an important piece in China’s market-reform measures. Is it time to learn Mandarin and jump in???
9 of our 10 ETFs in the Spotlight ended on the plus side while 8 of them made new highs as the YTD table below shows.
2. ETFs in the Spotlight
In case you missed the announcement and description of this section, you can read it here again.
It features 10 broadly diversified ETFs from my HighVolume list as posted every Monday. Furthermore, they are screened for the lowest MaxDD% number meaning they have been showing better resistance to temporary sell offs than all others over the past year.
Here are the 10 candidates:
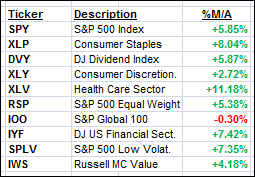
The above table simply demonstrates the magnitude with which some of the ETFs are fluctuating in regards to their positions above or below their respective individual trend lines (%M/A). A break below, represented by a negative number, shows weakness, while a break above, represented by a positive percentage, shows strength.
Year to date, here’s how the above candidates have fared so far:
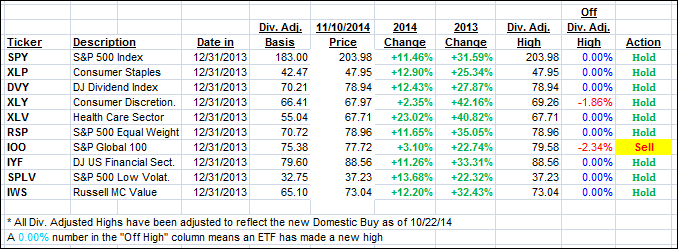
Again, the first table above shows the position of the various ETFs in relation to their respective long term trend lines (%M/A), while the second one tracks their trailing sell stops in the “Off High” column. The “Action” column will signal a “Sell” once the -7.5% point has been taken out in the “Off High” column.
3. Trend Tracking Indexes (TTIs)
Our Trend Tracking Indexes (TTIs) again improved as the table below shows. The International one edged a tad into bullish territory; however, the piercing of the line was not clear enough to call an end to the bear market. I like to see some staying power above the line before I consider this bearish period to be over.
Here’s how we closed:
Domestic TTI: +3.20% (last close +3.09%)—Buy signal since 10/22/2014
International TTI: +0.01% (last close -0.30%)—Sell signal since 10/1/2014
Disclosure: I am obliged to inform you that I, as well as advisory clients of mine, own some of these listed ETFs. Furthermore, they do not represent a specific investment recommendation for you, they merely show which ETFs from the universe I track are falling within the guidelines specified.
Contact Ulli