1. Moving the Markets
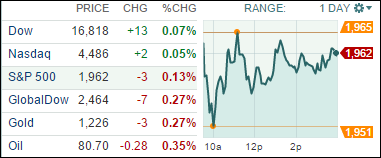
Stocks took somewhat of a “breather” on Monday, closing mixed just after coming off the best weekly performance of the year. The biggest drag on the markets was that oil prices fell to $80 a barrel, which marks a notable decline from the $107 price in June. Sinking oil prices suggests weakening global growth and signals that supply is outstripping demand. Oil prices are at their lowest levels since June 2012 and more than 20% below their 2014 highs. The S&P 500 dipped 0.13%, but the Dow rose 0.1% and the Nasdaq also added 0.1%.
In earnings news, this earnings season has seen more than 7 out of 10 companies, or 71.4%, in the S&P 500 top third-quarter earnings forecasts, better than the long-term average of 63%. So far, earnings growth is on track for a gain of 7.7%. This week was poised for a batch of earnings announcements from nearly 160 companies. Later this week will bring reports from Caesars (CZR), Electronic Arts (EA), Pfizer (PFE) Starbucks (SBUX) and Facebook (FB).
And in economic news, The Federal Reserve is expected to close a chapter in history this week and announce the conclusion of its massive stimulus program. Let’s stay tuned for this announcement and see if there are any immediate effects on market direction.
2. ETFs in the Spotlight
In case you missed the announcement and description of this section, you can read it here again.
It features 10 broadly diversified ETFs from my HighVolume list as posted every Monday. Furthermore, they are screened for the lowest MaxDD% number meaning they have been showing better resistance to temporary sell offs than all others over the past year.
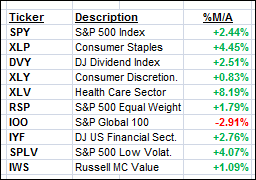
Here are the 10 candidates:
The above table simply demonstrates the magnitude with which some of the ETFs are fluctuating in regards to their positions above or below their respective individual trend lines (%M/A). A break below, represented by a negative number, shows weakness, while a break above, represented by a positive percentage, shows strength.
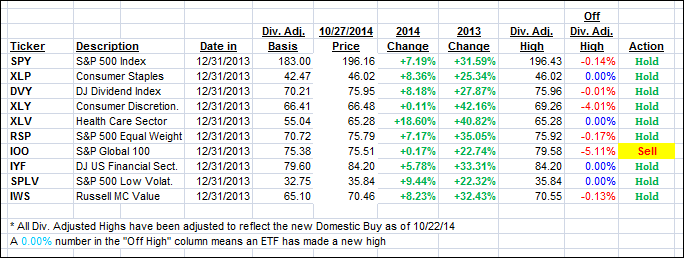
Year to date, here’s how the above candidates have fared so far:
To be clear, the first table above shows the position of the various ETFs in relation to their respective long term trend lines (%M/A), while the second one tracks their trailing sell stops in the “Off High” column. The “Action” column will signal a “Sell” once the -7.5% point has been taken out in the “Off High” column.
3. Trend Tracking Indexes (TTIs)
Our Trend Tracking Indexes (TTIs) moved only slightly as we saw big swings intra-day but in the end, the major indexes closed barely changed.
Here’s how we ended up:
Domestic TTI: +1.50% (last close +1.54%)—Buy signal since 10/22/2014
International TTI: -2.55% (last close -2.40%)—Sell signal since 10/1/2014
Disclosure: I am obliged to inform you that I, as well as advisory clients of mine, own some of these listed ETFs. Furthermore, they do not represent a specific investment recommendation for you, they merely show which ETFs from the universe I track are falling within the guidelines specified.
Contact Ulli


Comments 1
Why not focus on actual earning for comparable periods vs beating
earnings forecasts which are manipulated?