The ETF/No Load Fund Tracker
Monthly Review—July 31, 2014
Some US Indexes Slide Into Negative Territory In July; Europe Follows Suit
US equities finished July lower as a combination of disappointing economic news, drab corporate earnings and geopolitical tensions took its toll on investor sentiment, triggering a broad selloff in equities.
The Dow Jones Industrial Average ended the month 1.6 percent lower at 16,563.37 which turned its performance for 2014 negative. The blue-chip index shed 316.99 points, or 1.9 percent, on the last trading day of the month, its worst single-day performance since February 3.
The S&P 500 finished July at 1,930.67, down 1.5 percent for the month. All the 10 sectors of the benchmark index fell more than 1.5 percent on July 31 with energy and telecom stocks leading the losses.
The NASDAQ Composite Index closed at 4,369.77, tallying its monthly loss at 0.7 percent. The tech-heavy index slumped 93.13 points, or 2.1 percent, on the last business day of the month as investors became nervous about the Fed’s trigger points for raising rates ahead of Friday’s payrolls report.
The nonfarm payrolls report, released on the last day of the month, however, fell short of expectations. July US nonfarm payrolls increased by 209,000, which were smaller than the 230,000 gain most economists had forecast. Private payrolls performed worse, gaining only 198,000 jobs after adding 270,000 jobs in June. While the Labor Department revised job gains upwards by a total of 15,000 for May and June, the unemployment rate unexpectedly rose to 6.2 percent in July from 6.1 percent the previous month.
Labor force participation rate, a measure of working-age population in the labor force, ticked up to 62.9 percent from 62.8 percent in June. Average hourly earnings remained flat for the month after rising 0.2 percent in June while U6 unemployment rate, a gauge for under-employed and unemployed workers, inched up to 12.2 percent from 12.1 percent. Average workweek remained unchanged at 34.5 hours, validating Fed Chair Janet Yellen’s observation that there remains “significant underutilization of labor resources” that calls for loose monetary policy “for an extended period of time.”
The US economy continued to paint a mixed picture of recovery, with economic indicators hitting and missing economists’ forecasts in July. The economy made a strong comeback in the second quarter as consumer spending surged and business investments rebounded. Gross domestic product grew at a 4 percent annual pace after contracting by a downwardly-revised 2.1 percent in the first quarter. Consumer spending, the biggest component of the economy, jumped 2.5 percent as spending on big-ticket items such as cars and trucks accelerated. Spending on goods meant to last three years or more soared 14 percent, the biggest increase since 2009.
The Personal Consumption Expenses index, the Fed’s favorite gauge for measuring inflation, meanwhile grew at a 2.3 percent annual pace, the fastest since the second quarter of 2011. Core PCE, which excludes volatile items like food and energy, accelerated to a 2 percent annual clip from 1.2 percent in the first three months. While the Fed believes the sudden jump in inflation is temporary and expects price levels to moderate in the coming months, the central bank could be forced to raise interest rates sooner than it would like if proven wrong.
Pre-owned home sales fell unexpectedly in June, a separate report by the National Association for Realtors revealed. NAR’s Pending Home Sales Index, which is calculated after assessing the number of contracts signed, fell 1.1 percent to 102.7, missing forecasts for a 0.5 percent gain.
Shipment of non-defense capital goods excluding aircrafts, considered as a good proxy for business investments, fell 1 percent in June, while the reading for May was revised downward minus 0.1 percent, indicating business spending could soften in the next quarters.
Across the Atlantic, European stocks tracked Wall Street as weak economic data and falling inflation sapped demand for riskier assets. Weak price levels continued to haunt Europe with July inflation slipping to 0.4 percent from 0.5 percent in the previous two months. The July reading, the lowest since October 2009, is bad news for the European Central Bank as the bank announced a raft of liquidity measures in June to boost the region’s economy and bring inflation up to the bank’s target of 2 percent. Some economists, however, said the drop was temporary and argued a bigger-than-expected dip in non-core prices caused the decline.
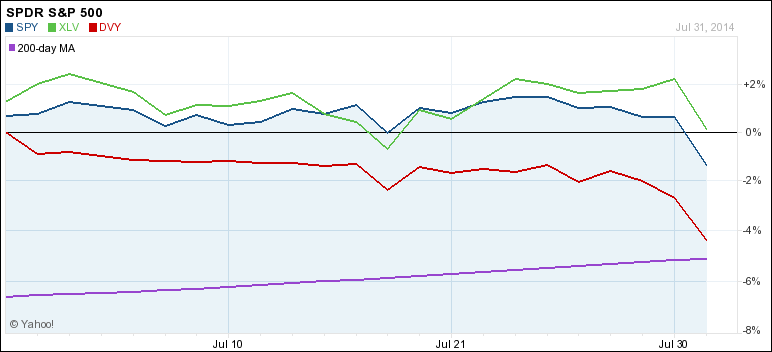
The trend reversal in the indexes affected our holdings to varying degrees. First, the close up performance of our main holdings over the month of July:
DVY was the weakling while SPY held up fairly well. Only healthcare (XLV) managed to stay on the plus side of the ledger for this period supporting the leading role it has played all year.
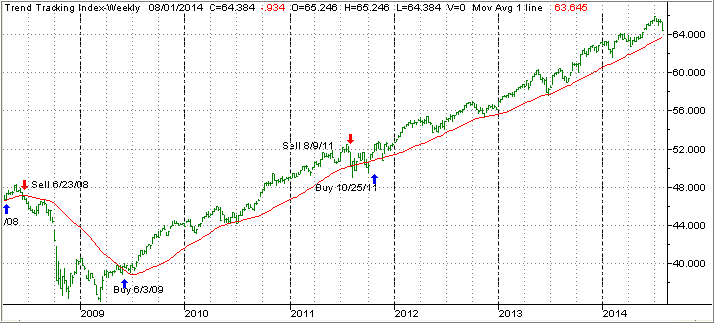
On to the big picture. Our Domestic Trend Tracking Index (TTI) came off its high as the following chart shows:
Notice how the last green bar on the upper right turned south and headed towards its long-term trend line (red). This happened during the last week of July, however, the TTI remains above is trend line by +1.23% and therefore in bullish territory.
It’s too early to tell if that drop was only an aberration or an indication of things to come. For sure, we are long overdue for a correction. The good news is that it won’t take much of a drop for our above indicator to signal a move out of equities, which means that we will be able to most likely escape with gains on most of our positions rather than losses.
Our trailing sell stops provide another measure of downside protection, which will be sorely needed if and when this cycle comes to its inevitable end.
Contact Ulli

