1. Moving The Markets
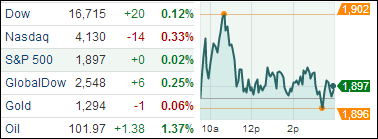
The S&P 500 and the Dow both edged to new highs again today, while the Nasdaq resumed its oh too familiar slide. Cisco Systems Inc (CSCO), which is set to report its quarterly earnings results on Wednesday, was the biggest drag on the Nasdaq. The stock slid 1.4%.
It was a big day for coffee machine innovator Keurig Green Mountain (GMCR). The stock ended up 7.6% to $119.07 per share after Coca-Cola (KO), just three months after buying a 10% stake in Keurig, announced it increased its stake to 16%. Coke is now the largest shareholder in Keurig.
We saw a bit of disappointing economic news today. Retail sales grew only 0.1% in April, which disappointed forecasters, who expected more of an early spring pick-up. Economists’ had forecast a 0.5% gain.
It has been a while since we discussed gold here in our moving the markets segment, so let’s revisit. In short, gold has been hammered since its peak of $1,895 per ounce in September 2011. Today it’s down to $1,293 and experts say the meltdown could continue until gold hits $800 or less. Investors normally turn to gold when the world feels more dangerous. But despite recent troubles in the Ukraine, gold has continued to fall from a price of $1,385 in March. Just today, UBS lowered its one-month forecast to $1,250 from $1,280 an ounce and adjusted its three-month forecast from to $1,300 from $1,350 an ounce.
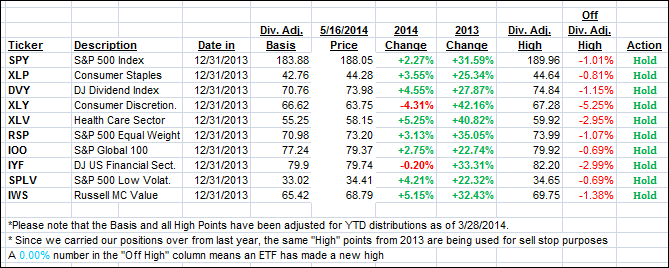
4 of our 10 ETFs in the Spotlight made new highs today while 9 of them remain on the plus side YTD.
2. ETFs in the Spotlight
In case you missed the announcement and description of this section, you can read it here again.
It features 10 broadly diversified ETFs from my HighVolume list as posted every Monday. Furthermore, they are screened for the lowest MaxDD% number meaning they have been showing better resistance to temporary sell offs than all others over the past year.
In other words, none of them ever triggered their 7.5% sell stop level during this time period, which included a variety of severe market pullbacks but no move into outright bear market territory.
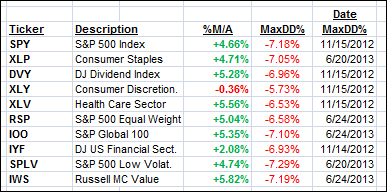
Here are the 10 candidates:
All of them are in “buy” mode, meaning their prices are above their respective long term trend lines by the percentage indicated (%M/A).
Year to date, here’s how the above candidates have fared so far:
To be clear, the first table above shows the position of the various ETFs in relation to their respective long term trend lines (%M/A), while the second one tracks their trailing sell stops in the “Off High” column. The “Action” column will signal a “Sell” once the -7.5% point is taken out in the “Off High” column.
3. Domestic Trend Tracking Indexes (TTIs)
Our Trend Tracking Indexes (TTIs) meandered and barely changed from yesterday’s close:
Domestic TTI: +2.61% (last close +2.67%)
International TTI: +3.65% (last close +3.58%)
Disclosure: I am obliged to inform you that I, as well as advisory clients of mine, own some of these listed ETFs. Furthermore, they do not represent a specific investment recommendation for you, they merely show which ETFs from the universe I track are falling within the guidelines specified.
Contact Ulli


