My latest No Load Fund/ETF Tracker has been posted at:
http://www.successful-investment.com/newsletter-archive.php
A double punch of high unemployment and even higher oil prices sent all major indexes down for the week.
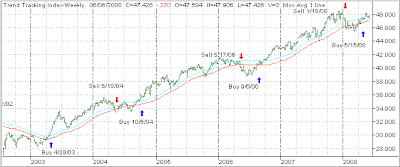
Our Trend Tracking Index (TTI) for domestic funds/ETFs has moved lower but remains +0.73% above its long-term trend line (red). 
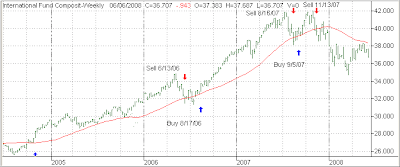
The international index dropped as well and now remains -4.33% below its own trend line, keeping us on the sidelines.

For more details, and the latest market commentary, as well as the updated No load Fund/ETF StatSheet, please see the above link.

Comments 4
I enjoy reading your posts and thanks for clarifying your TTI. One question:
In your domestic TTI, there is a red line (which is the 195 day MA of your TTI, I think) and there is another line above the same. What is that line? Is it another 1% raise above the MA line?
In the international TTI, we do not see the secone line. Can you please clarify.
Thanks.
The blue line represents the upper end of the neutral zone, which I always refer to. It’s 1.5% above the 39-week M/A.
Ulli…
Would you please take a moment to elaborate on your sell strategy.
1. You will sell if the TTI falls below the 195 day MA. Will you sell even if the price of your mutual fund has fallen only by, say, 4%. Or will you wait till the price drops by 7% thought the TTI has fallen below the 195 day MA?
Your posting on Trend clarification is great. But if you could elaborate on your sell strategy, it will benefit people like me.
My apologies if the question is unclear.
Thanks.
That’s a very good question, which I will turn into a blog post either on Monday or Tuesday.
Ulli…