
- Moving the market
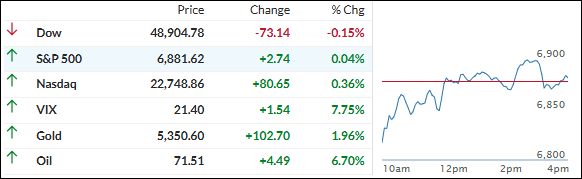
Stocks tanked early after the weekend news of U.S. and Israel strikes on Iran, spiking oil prices and adding Middle East instability to the growing list of investor worries.
The major averages hit session lows hard—the Dow was down about 600 points at one point—but rallied back thanks to gains in tech like Nvidia and Microsoft.
Gold futures surged almost 2% as a safe-haven play, and the VIX (Wall Street’s fear gauge) jumped to its highest levels of 2026 so far.
President Trump told CNBC’s Joe Kernen that U.S. operations in Iran are “ahead of schedule,” but traders are still jittery about a prolonged conflict. U.S. crude climbed almost 8% on fears of supply disruptions—Iran’s the fourth-largest OPEC producer, after all.
By the close, the indexes had bounced impressively: the Dow and S&P 500 basically broke even, while the Nasdaq eked out a modest green finish.
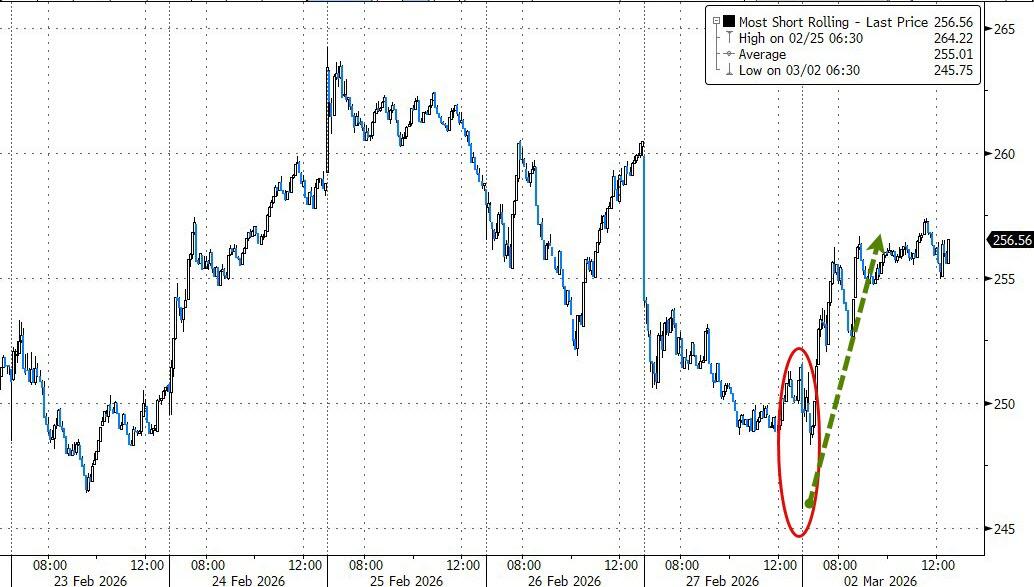
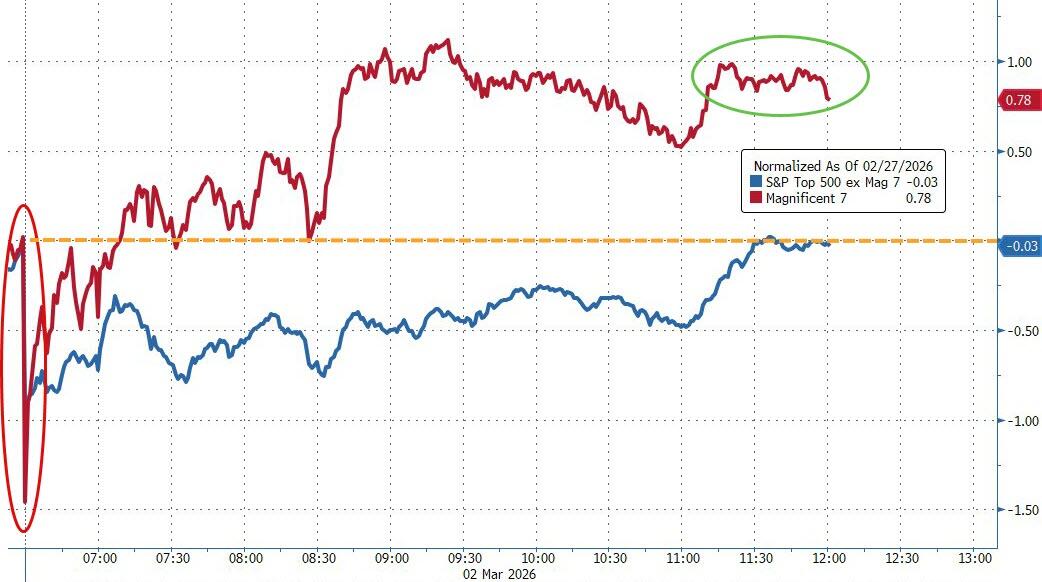
A big short squeeze off the lows helped small caps score a winning session, and the Mag 7 even outperformed the rest of the S&P 493 for a change.
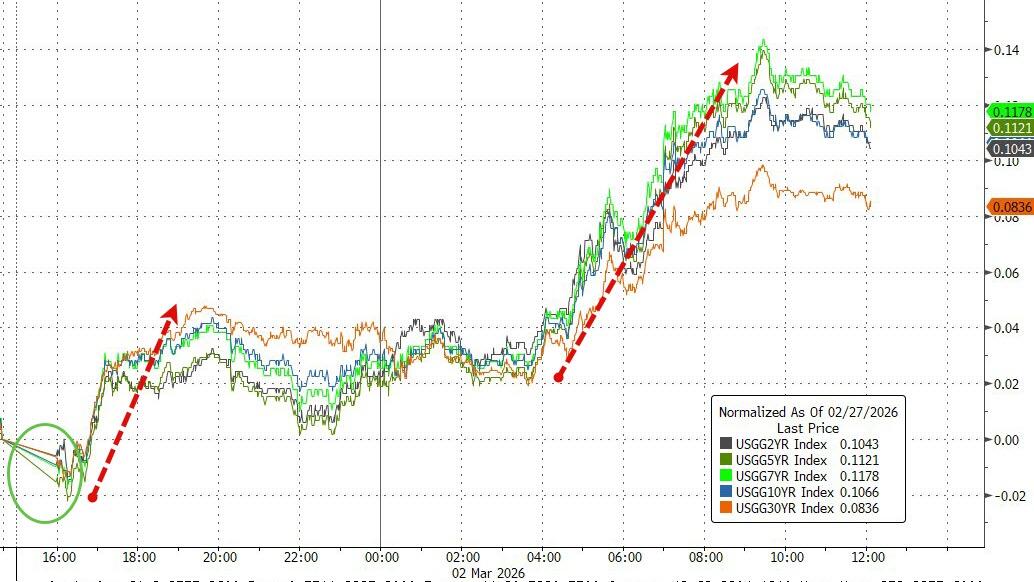
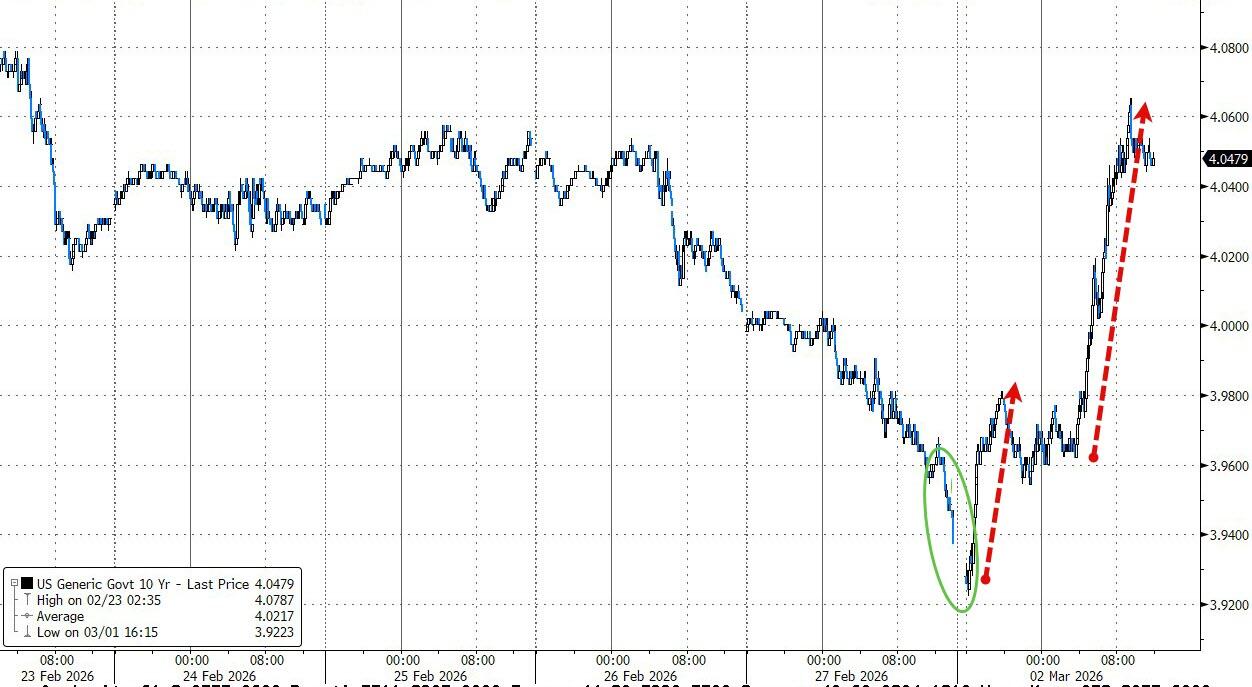
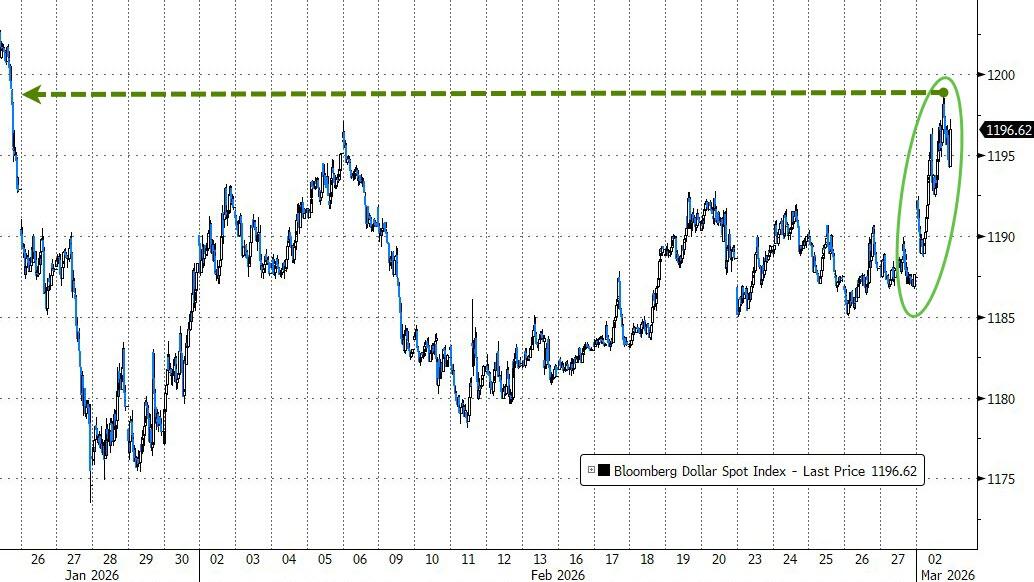
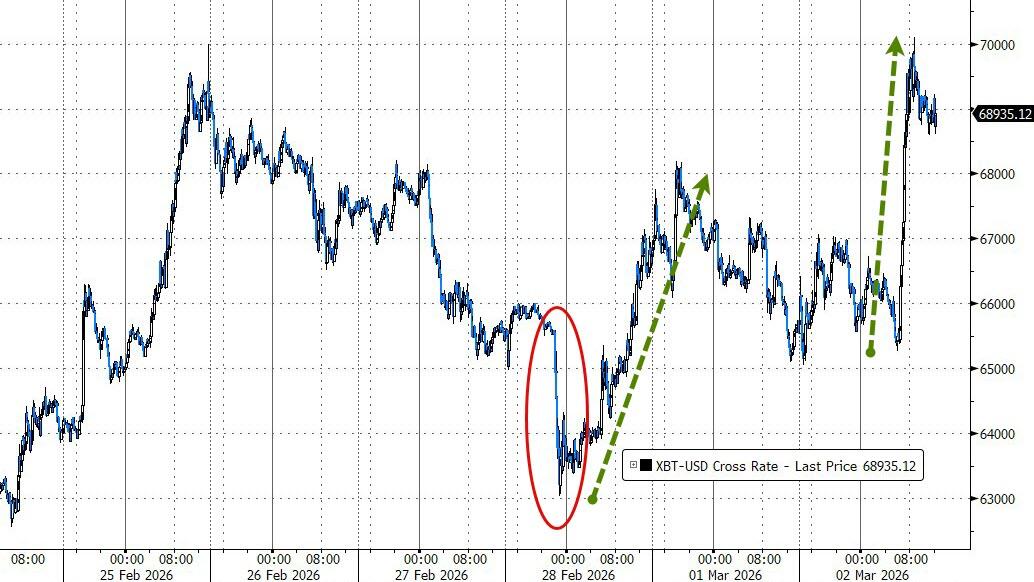
Bond yields surged (10-year back above 4%), the dollar hit 1-month highs, Bitcoin tested $70k but closed below it, gold soared to $5,350, and silver bounced early but ended flat.
Right now, there are more questions than answers, but a stabilizing energy picture could ripple positively, while fears of longer-term disruption might do the opposite.
2. Current domestic “Buy” Cycle (effective 5/20/2025); International “Buy” Cycle (effective 5/8/25)
Our domestic bullish cycle that began on November 21, 2023, concluded on April 3, 2025, following a market downturn triggered by President Trump’s tariff policy announcement.
This development caused significant declines across major indexes and broader market indices. However, markets subsequently rebounded, culminating in a new domestic “Buy” signal taking effect May 20, 2025.
Concurrently, our International Trend Tracking Index (TTI) experienced parallel volatility. On April 4, 2025, it breached critical thresholds, prompting a “Sell” recommendation. This position reversed as global markets recovered, with the International TTI regaining sufficient momentum to issue a new “Buy” signal effective May 8, 2025.
3. Trend Tracking Indexes (TTIs)
The session started with a sharp sell-off—especially in the Dow—which had everything looking pretty ugly early on.
But the buyers stepped in, staged a solid comeback, and by the close the Dow and S&P 500 had clawed their way back to basically unchanged. The Nasdaq managed to finish in the green, giving the day a slightly positive tilt.
Our TTIs had a mixed day: the international one took a bigger hit, while the domestic one only gave up a tiny fraction and held up much better.
This is how we closed 03/02/2026:
Domestic TTI: +8.23% above its M/A (prior close +8.43%)—Buy signal effective 5/20/25.
International TTI: +11.30% above its M/A (prior close +12.47%)—Buy signal effective 5/8/25.
All linked charts above are courtesy of Bloomberg via ZeroHedge.
———————————————————-
WOULD YOU LIKE TO HAVE YOUR INVESTMENTS PROFESSIONALLY MANAGED?
Do you have the time to follow our investment plans yourself? If you are a busy professional who would like to have his portfolio managed using our methodology, please contact me directly to get more details.
Contact Ulli