
ETF Tracker StatSheet
You can view the latest version here.
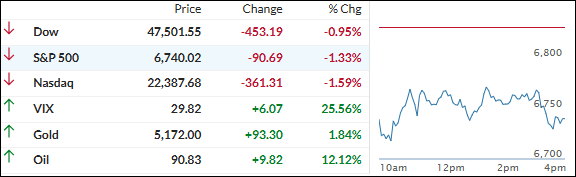
WEAK JOBS REPORT + OIL SPIKE – STOCKS SLIDE, MAG 7 HOLDS FIRM
- Moving the market
Stocks opened lower and stayed soft all day, adding to their weekly losses as oil prices spiked higher and traders digested a surprisingly weak February jobs report.
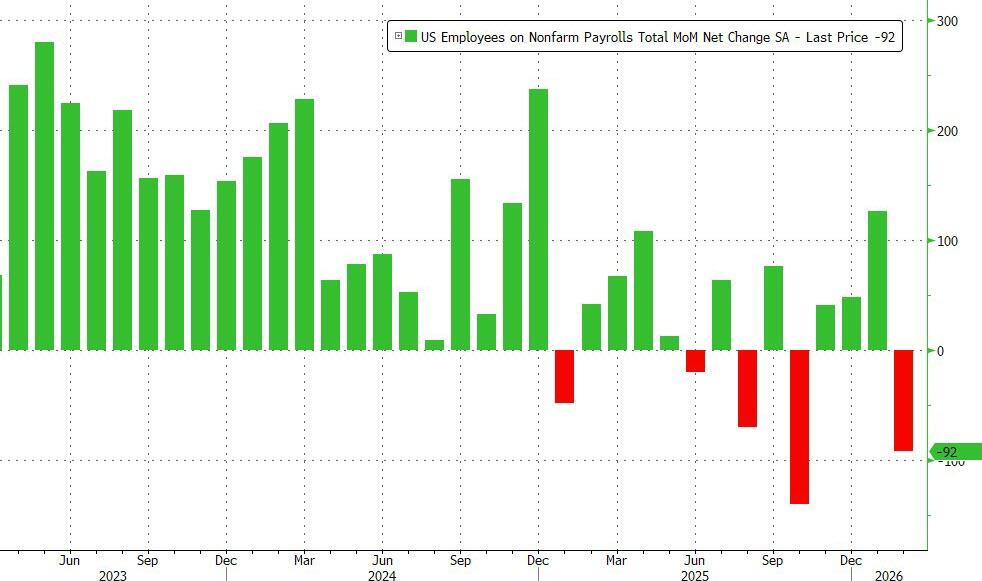
Nonfarm payrolls dropped by -92,000 (a big miss vs. the expected +50,000 gain), with the unemployment rate ticking up to 4.4% from 4.3%. Ouch! That soft labor data, combined with persistent inflation concerns, kept the risk-off mood alive.
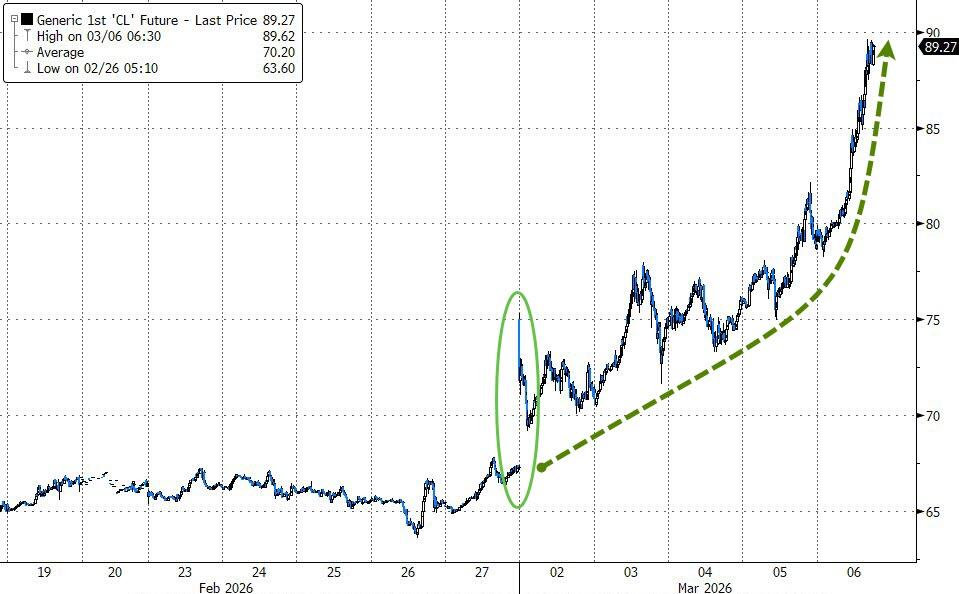
West Texas Intermediate crude broke above $89 a barrel, and Brent traded over $91 as worries grew about potential supply disruptions from the ongoing U.S.-Iran conflict.
Higher energy costs are putting more pressure on consumer spending and complicating the Fed’s rate decisions—soft jobs + sticky inflation isn’t the Goldilocks scenario anyone wants.
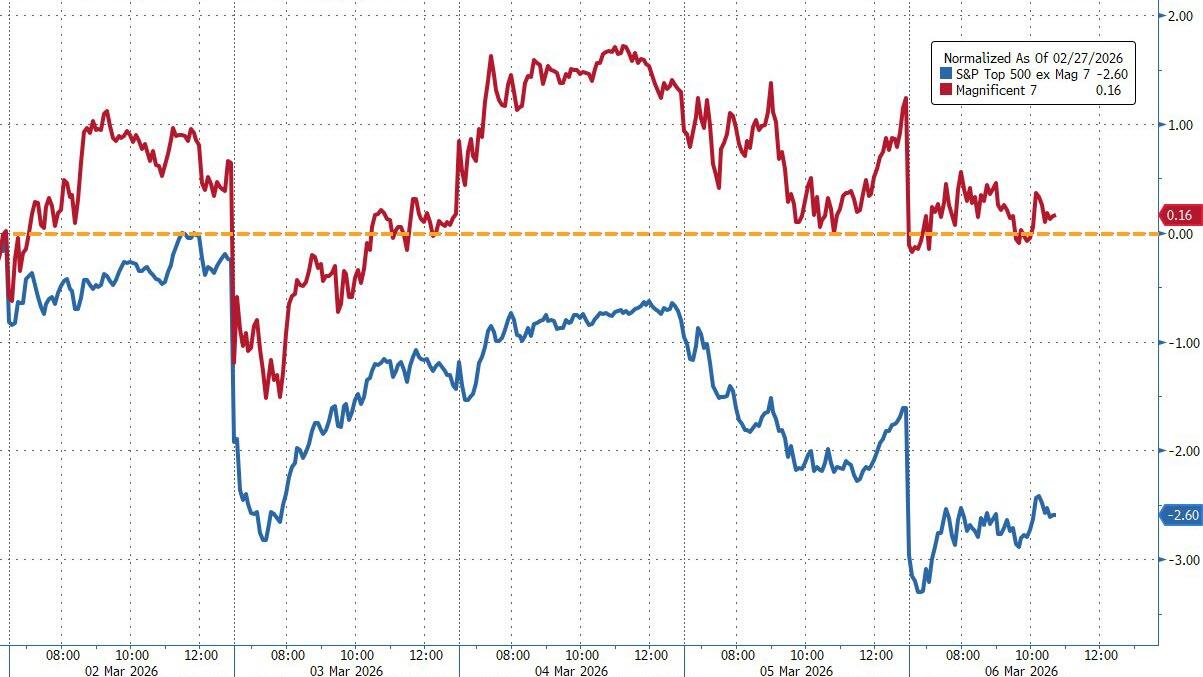
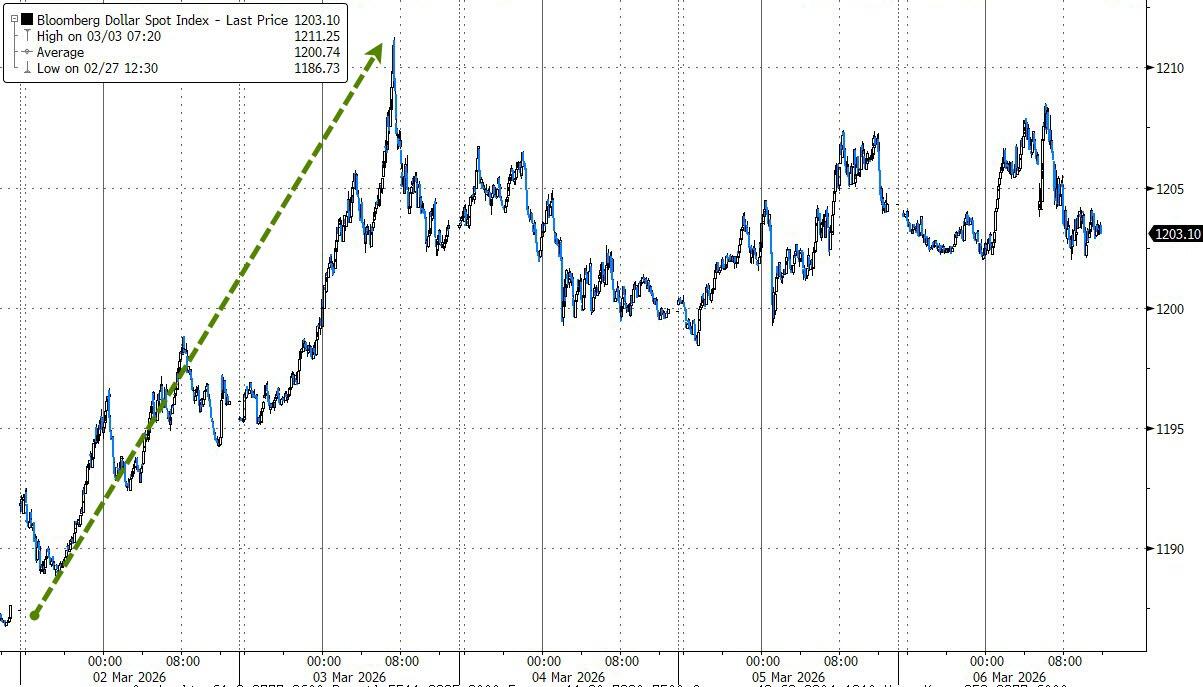
The Mag 7 actually outperformed the rest of the S&P 493 this week, acting almost like a safe-haven flow alongside the dollar (which held firm).
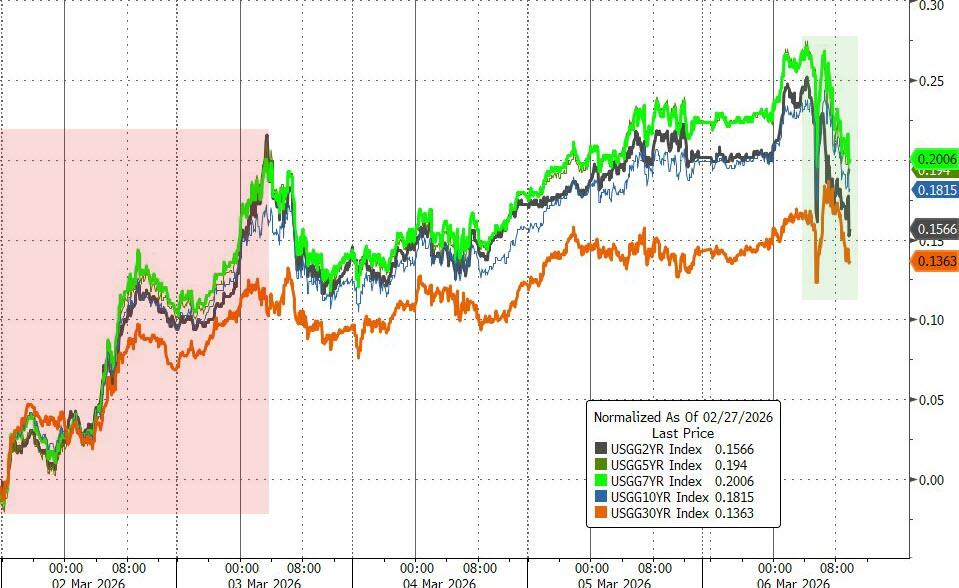
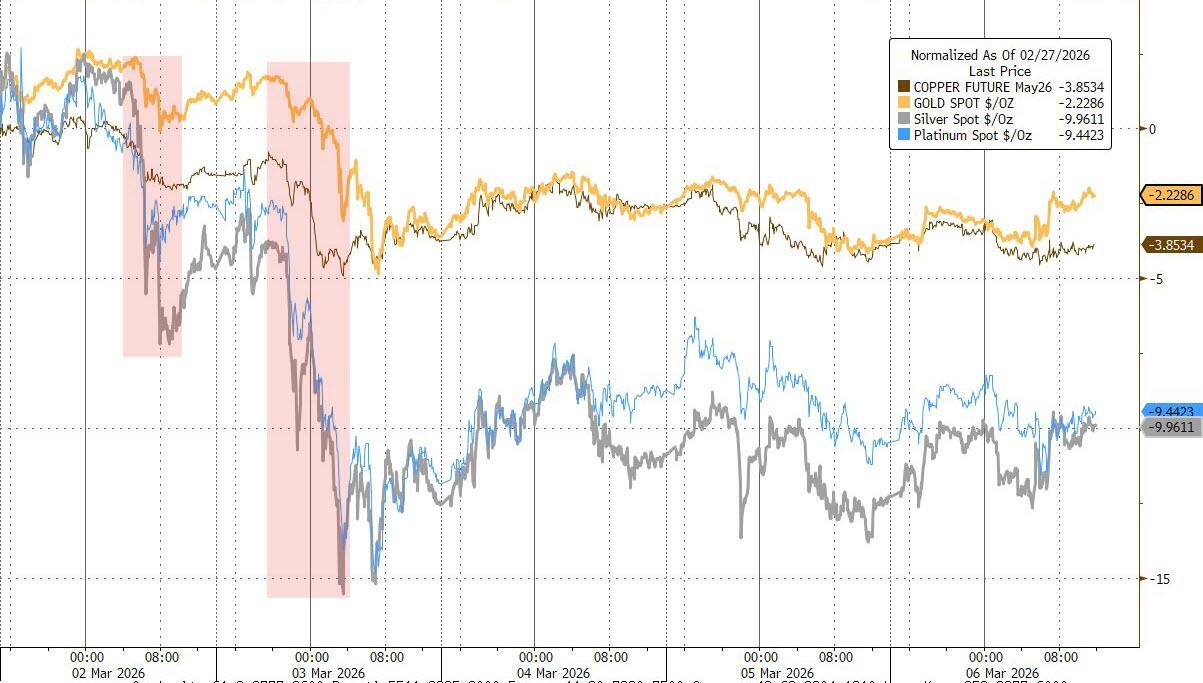
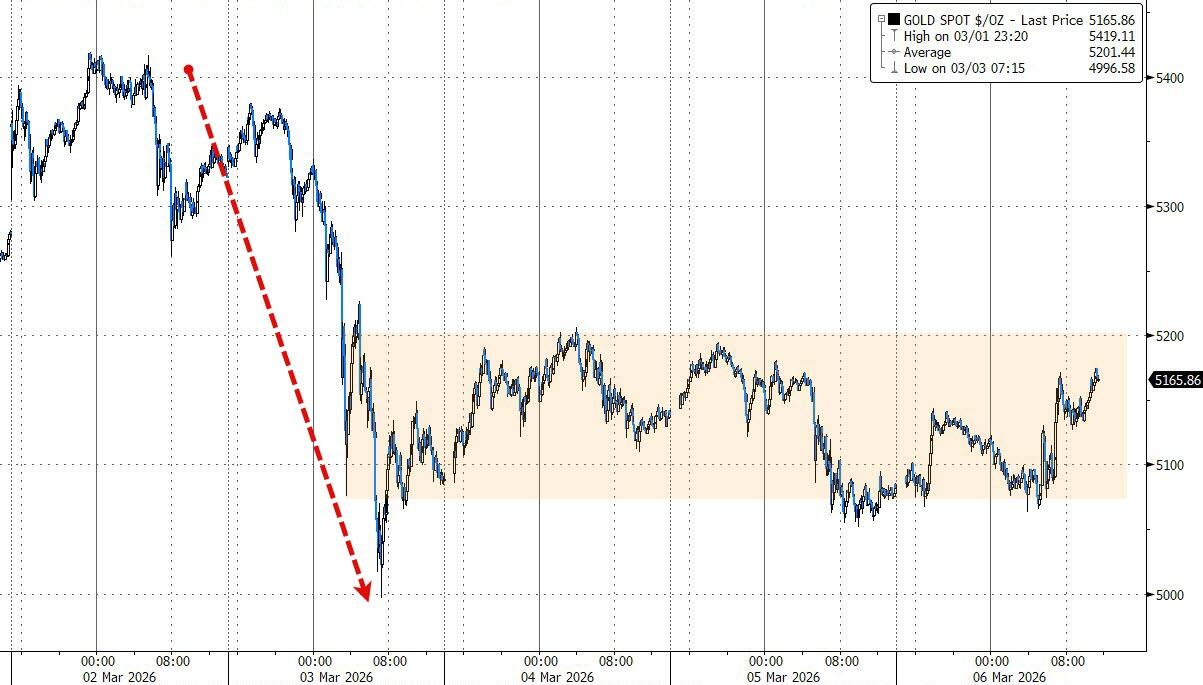
Bond yields spiked but backed off their highs today. Precious metals had a choppy week overall—treading water after Monday/Tuesday’s sell-off—but gold found support around $5,000 and swung sideways.
Silver lagged, and Bitcoin ended the week basically unchanged after hitting highs midweek.
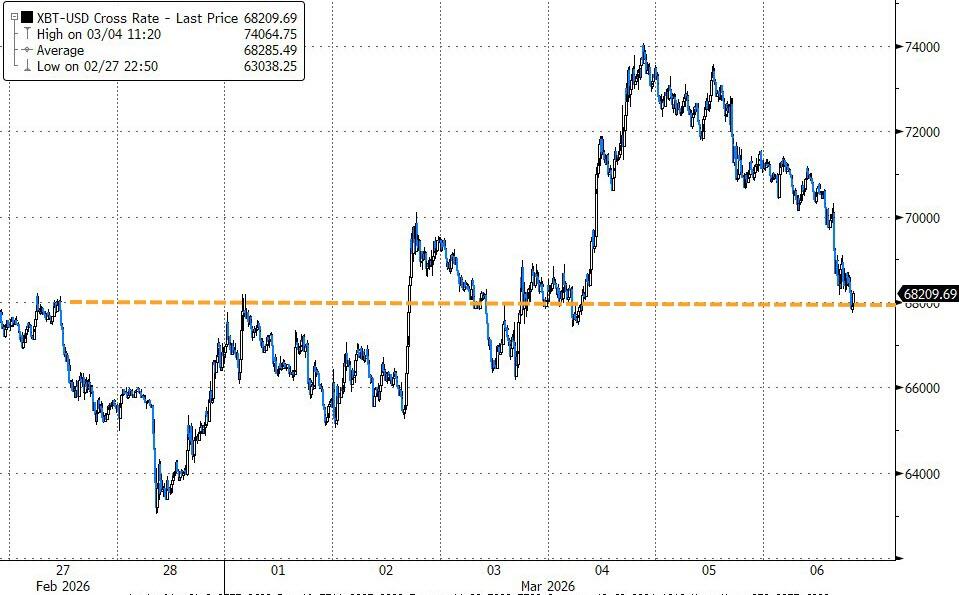
Traders are now wondering if oil heads toward $100 next week and what kind of reckoning stocks might face if history repeats.
2. Current domestic “Buy” Cycle (effective 5/20/2025); International “Buy” Cycle (effective 5/8/25)
Our domestic bullish cycle that began on November 21, 2023, concluded on April 3, 2025, following a market downturn triggered by President Trump’s tariff policy announcement.
This development caused significant declines across major indexes and broader market indices. However, markets subsequently rebounded, culminating in a new domestic “Buy” signal taking effect May 20, 2025.
Concurrently, our International Trend Tracking Index (TTI) experienced parallel volatility. On April 4, 2025, it breached critical thresholds, prompting a “Sell” recommendation. This position reversed as global markets recovered, with the International TTI regaining sufficient momentum to issue a new “Buy” signal effective May 8, 2025.
3. Trend Tracking Indexes (TTIs)
Yesterday’s negative vibe carried straight into today, with the bears staying firmly in control from open to close.
The major indexes finished solidly in the red for both the day and the full week, as surging oil prices and rising bond yields completely killed any lingering bullish momentum.
The one bright spot? The metals stepped up and saved the day for our portfolios, closing in the green and providing some much-needed cushion.
Our TTIs couldn’t fully escape the pressure—they retreated along with the broader market—but they’re still comfortably sitting on the bullish side of their long-term trend lines, just at narrower margin than before.
This is how we closed 03/06/2026:
Domestic TTI: +4.52% above its M/A (prior close +6.09%)—Buy signal effective 5/20/25.
International TTI: +6.81% above its M/A (prior close +7.98%)—Buy signal effective 5/8/25.
All linked charts above are courtesy of Bloomberg via ZeroHedge.
———————————————————-
WOULD YOU LIKE TO HAVE YOUR INVESTMENTS PROFESSIONALLY MANAGED?
Do you have the time to follow our investment plans yourself? If you are a busy professional who would like to have his portfolio managed using our methodology, please contact me directly to get more details.
Contact Ulli