
ETF Tracker StatSheet
You can view the latest version here.
DOMESTIC TTI BREAKS TREND LINE – GEOPOLITICS WEIGHS HEAVY
- Moving the market
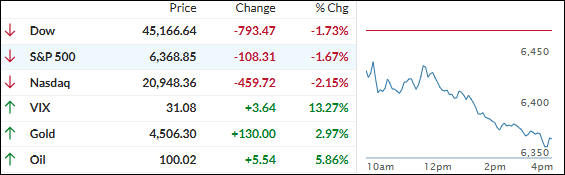
Stocks tumbled early and never really recovered, as fresh worries about the U.S.-Iran conflict and surging oil prices kept the bears firmly in control.
Brent crude traded above $110 a barrel after new incidents in the Strait of Hormuz, while President Trump’s latest comments failed to reassure traders enough to start buying.
The Nasdaq officially fell into correction territory (down more than 10% from its October record), and the Dow flirted with the same territory after dipping below it intraday. For the full week, the Nasdaq was the biggest loser (down over 3%), followed by the S&P 500.
Interestingly, small caps eked out a small gain thanks to two big short squeezes earlier in the week.
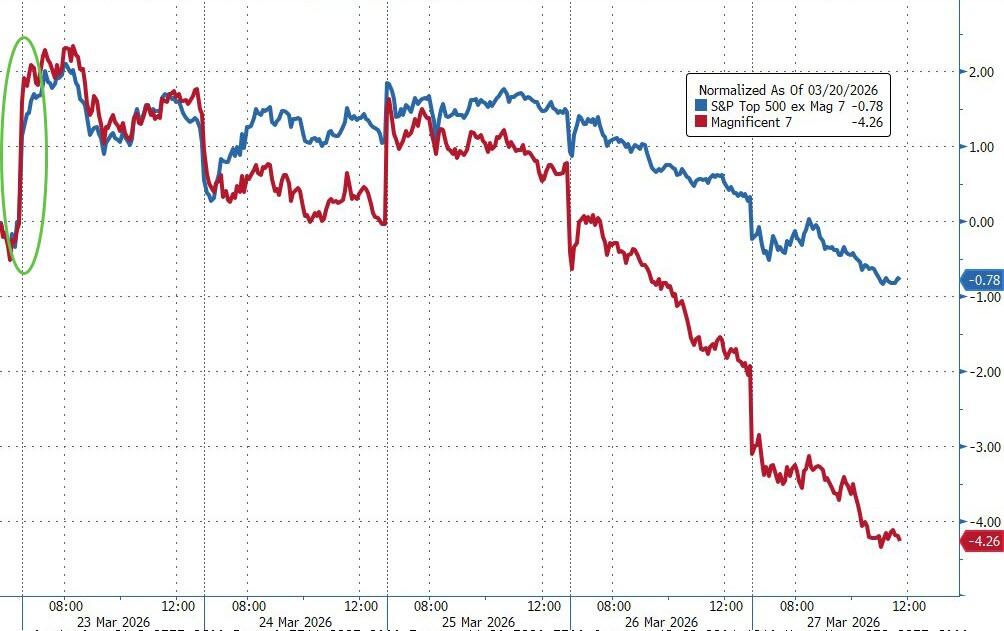
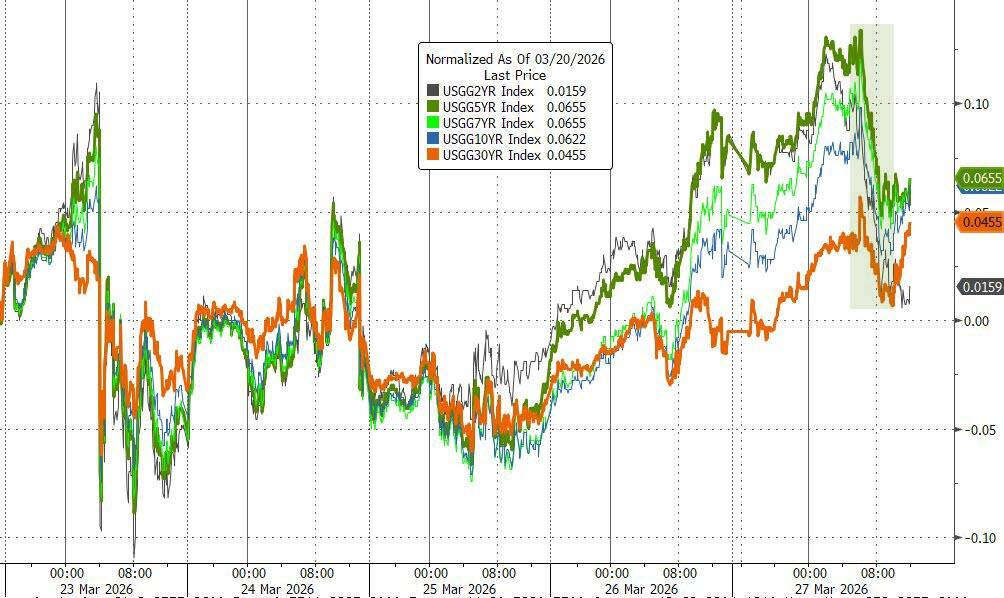
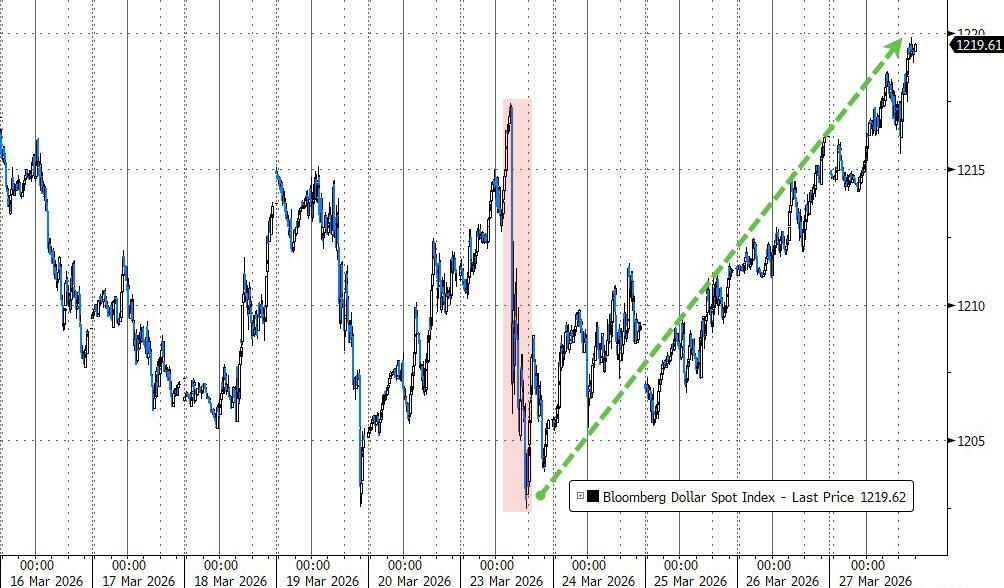
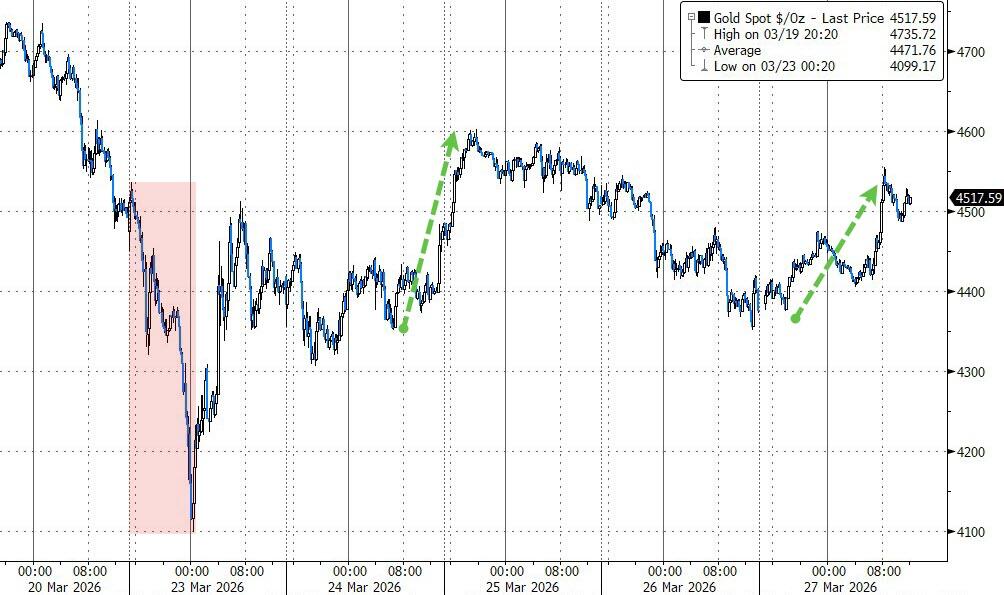
The Mag 7 continued to dramatically underperform the rest of the S&P 493. Bond yields rose across the curve (though they softened a bit today), the dollar surged for the third week in the last four, and gold finally acted like a safe haven again, pushing back above $4,500.
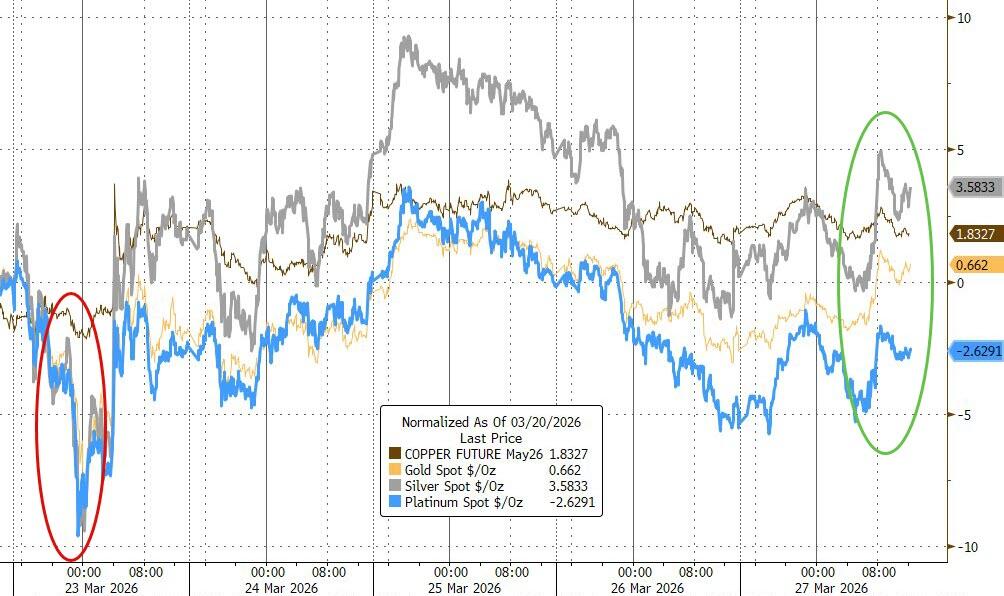
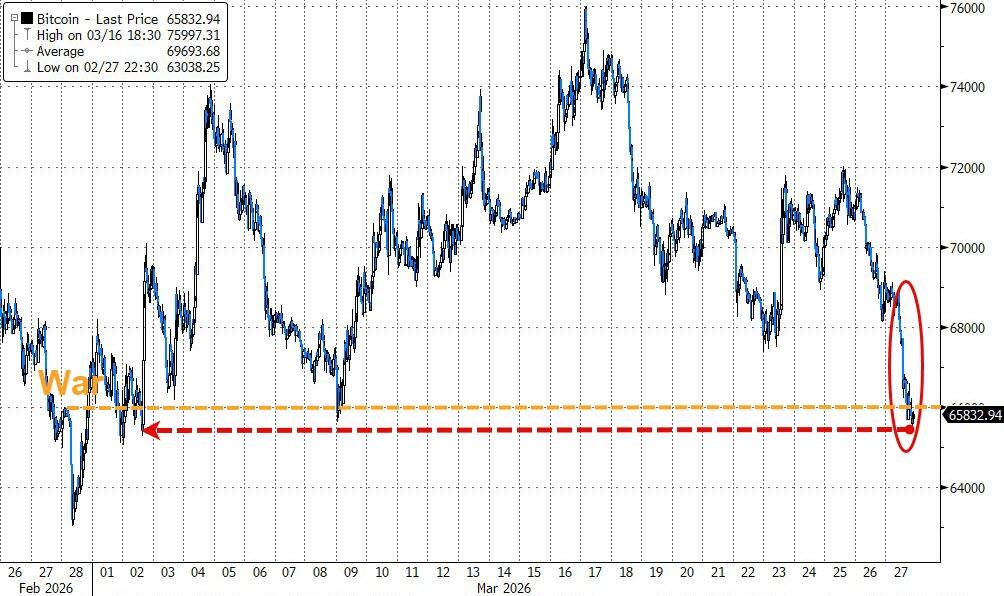
Silver and copper outperformed gold for the week, while Bitcoin retreated below $66K but remains roughly unchanged since the war began.
Today’s drop pushed our domestic TTI below its long-term trend line (more details in section 3). The international TTI held up better but is also under pressure.
At this point, it feels like traders are no longer falling for the occasional glimmer of hope being jawboned about. They’re becoming more demanding for real progress, and any absence of it could lead to even more negative market moves.
2. Current domestic “Buy” Cycle (effective 5/20/2025); International “Buy” Cycle (effective 5/8/25)
Our domestic bullish cycle that began on November 21, 2023, concluded on April 3, 2025, following a market downturn triggered by President Trump’s tariff policy announcement.
This development caused significant declines across major indexes and broader market indices. However, markets subsequently rebounded, culminating in a new domestic “Buy” signal taking effect May 20, 2025.
Concurrently, our International Trend Tracking Index (TTI) experienced parallel volatility. On April 4, 2025, it breached critical thresholds, prompting a “Sell” recommendation. This position reversed as global markets recovered, with the International TTI regaining sufficient momentum to issue a new “Buy” signal effective May 8, 2025.
3. Trend Tracking Indexes (TTIs)
It looks like the endless jawboning via social media posts has finally lost its magic.
Traders are clearly more interested in real, verifiable information right now. Since that wasn’t available today, the bears stayed firmly in charge and pushed the major indexes lower, with the S&P 500 giving up about 2% for the full week.
The one saving grace?
The metals stepped up and helped balance out some of those equity losses, keeping our portfolios from taking a bigger hit.
On the TTI front, the domestic one finally slipped below its long-term trend line, which technically signals a shift from bullish to bearish.
However, to avoid getting whipsawed, I want to see it show some real staying power below the line before we consider exiting our domestic equity positions. That could very well play out next week.
Meanwhile, the international TTI held up better and is still sitting almost 2% above its trend line, so its bullish outlook hasn’t changed yet.
This is how we closed 03/27/2026:
Domestic TTI: -0.75% below its M/A (prior close +0.31%)—Buy signal effective 5/20/25.
International TTI: +1.93% above its M/A (prior close +3.10%)—Buy signal effective 5/8/25.
All linked charts above are courtesy of Bloomberg via ZeroHedge.
———————————————————-
WOULD YOU LIKE TO HAVE YOUR INVESTMENTS PROFESSIONALLY MANAGED?
Do you have the time to follow our investment plans yourself? If you are a busy professional who would like to have his portfolio managed using our methodology, please contact me directly to get more details.
Contact Ulli