
ETF Tracker StatSheet
You can view the latest version here.
CPI COMES IN SOFT – STOCKS FLAT, GOLD BACK ABOVE $5,000
- Moving the market
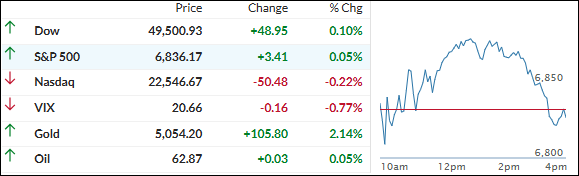
The S&P 500 spent the early part of the day just treading water, and the month ended basically flat as the latest consumer inflation report (January CPI) came in softer than expected but didn’t spark any big rally.
Headline CPI rose 0.2% month-over-month (annualized 2.4%), beating the forecasted 0.3% MoM and 2.5% YoY. Core CPI (excluding food & energy) matched expectations at 0.3% MoM and 2.5% YoY.
The number was a bit of a relief after the strong payrolls data earlier in the week—giving the Fed a touch more room to stay dovish without inflation looking too sticky.
Still, it’s above their target, so near-term policy isn’t moving much. Rate-cut expectations barely budged.
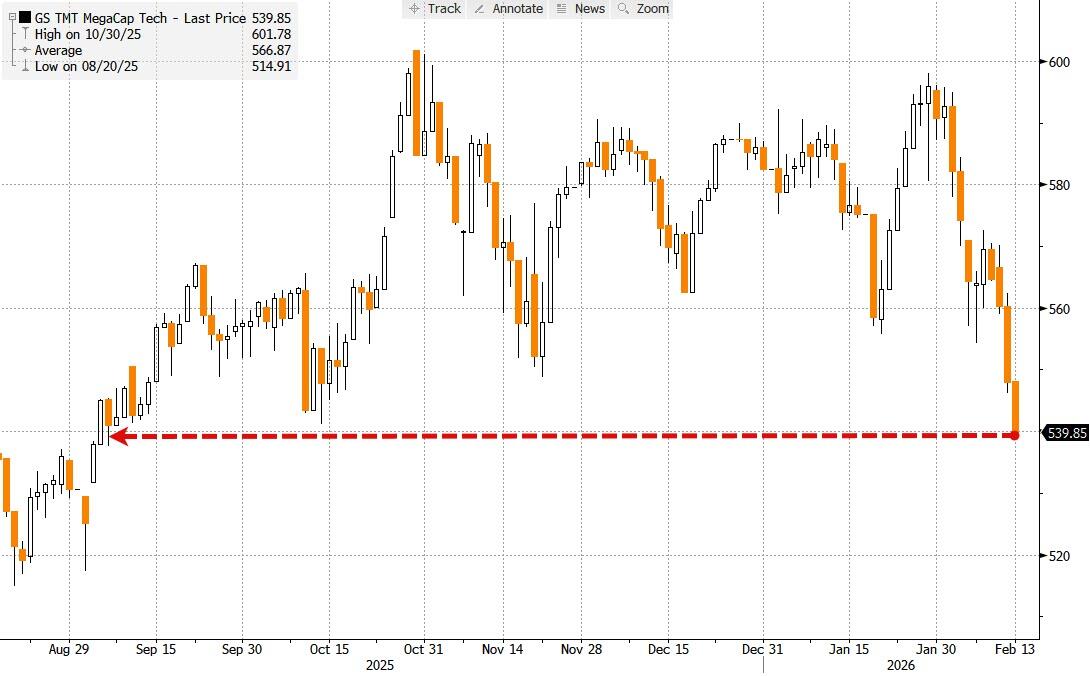
The bigger story this week was ongoing jitters about AI disruption. Fears that AI could upend revenue in industries like real estate, trucking, software, financial services, and even media (hitting names like Disney -3% and Netflix -7% for the week) kept pressure on growth stocks.
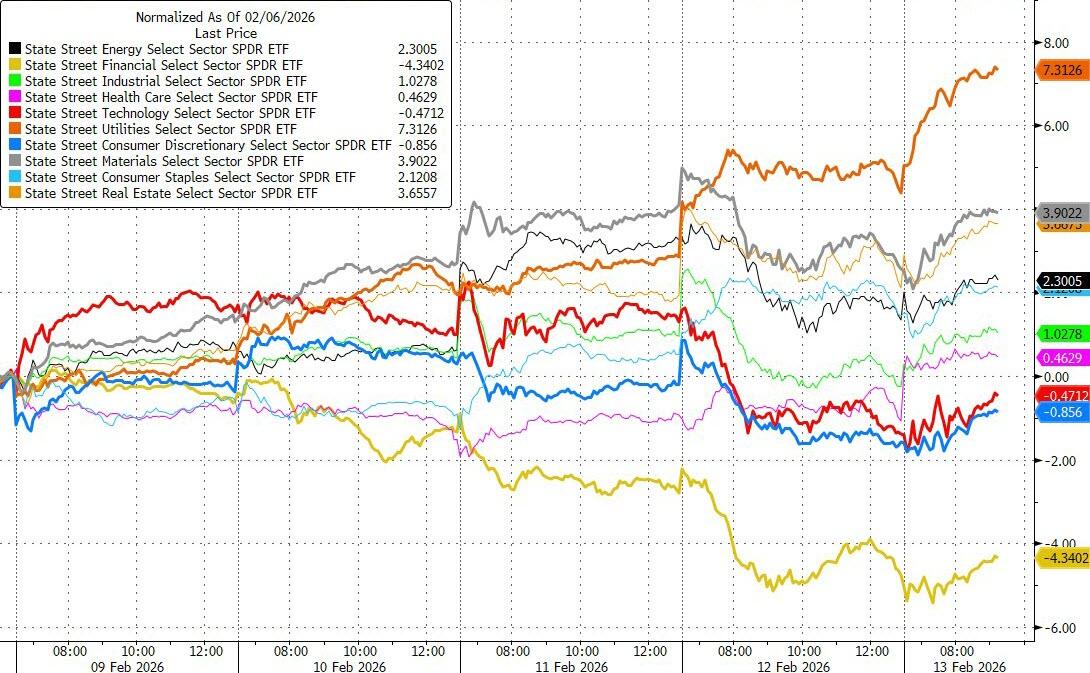
Mega-cap tech plunged for a fourth straight day, sinking to its lowest since September 2025, while utilities quietly became the go-to safe haven.
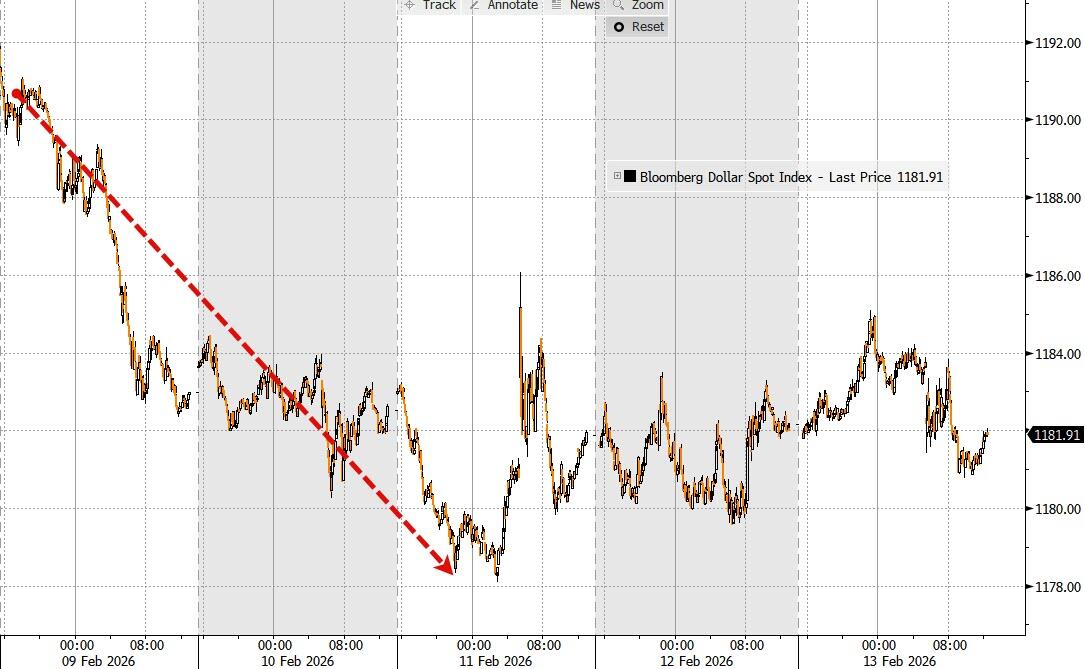
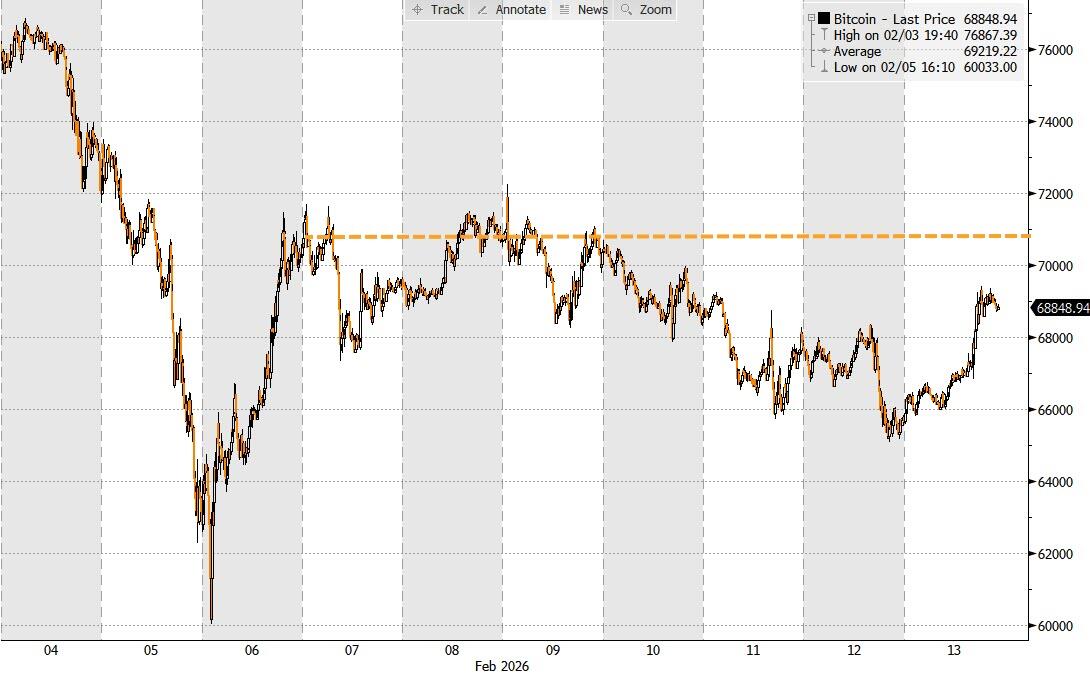
Bond yields retreated (helping equities a bit), rate-cut odds ticked higher, the dollar ended the week lower, and Bitcoin tested $69K today but stayed volatile overall.
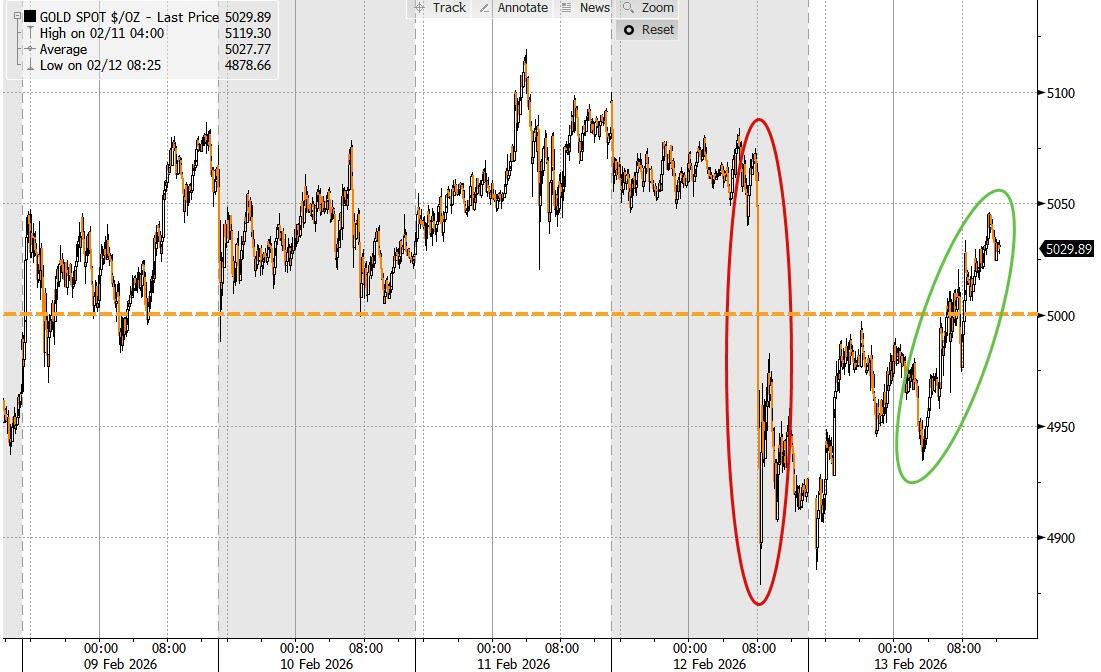
Gold managed to gain for the week and recapture $5,000, while silver advanced today but slipped slightly overall.
Despite the chop, earnings season remains a bright spot—US companies are posting strong profit growth again, with +12% year-over-year, marking five straight quarters of double-digit increases.
That’s something to cheer about.
2. Current domestic “Buy” Cycle (effective 5/20/2025); International “Buy” Cycle (effective 5/8/25)
Our domestic bullish cycle that began on November 21, 2023, concluded on April 3, 2025, following a market downturn triggered by President Trump’s tariff policy announcement.
This development caused significant declines across major indexes and broader market indices. However, markets subsequently rebounded, culminating in a new domestic “Buy” signal taking effect May 20, 2025.
Concurrently, our International Trend Tracking Index (TTI) experienced parallel volatility. On April 4, 2025, it breached critical thresholds, prompting a “Sell” recommendation. This position reversed as global markets recovered, with the International TTI regaining sufficient momentum to issue a new “Buy” signal effective May 8, 2025.
3. Trend Tracking Indexes (TTIs)
The major indexes opened lower and spent the morning looking a little shaky. Then the latest CPI report came in softer than expected, sparking a decent midday recovery rally that lifted everything into positive territory for a while.
But the bulls couldn’t quite keep the fire going — momentum faded late, and we closed basically flat, right around unchanged.
The real bright spots?
Utilities held up strong and the metals sector stepped up as well, acting as the day’s saviors while most other areas drifted.
Our TTIs showed a split personality: the international one basically treaded water, while the domestic one kicked into gear and accelerated nicely to the upside.
This is how we closed 02/13/2026:
Domestic TTI: +8.24% above its M/A (prior close +7.50%)—Buy signal effective 5/20/25.
International TTI: +12.19% above its M/A (prior close +12.79%)—Buy signal effective 5/8/25.
All linked charts above are courtesy of Bloomberg via ZeroHedge.
———————————————————-
WOULD YOU LIKE TO HAVE YOUR INVESTMENTS PROFESSIONALLY MANAGED?
Do you have the time to follow our investment plans yourself? If you are a busy professional who would like to have his portfolio managed using our methodology, please contact me directly to get more details.
Contact Ulli