
- Moving the market
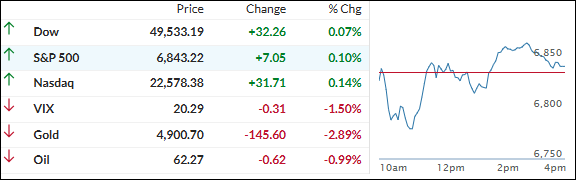
The major indexes opened in the red to kick off this holiday-shortened week, with tech leading the downside and pulling the metals along for the ride.
Software names (already beaten up) took another hit on ongoing fears that AI tools could eventually replace a lot of industry-specific programs.
Meta Platforms, Nvidia, and Palantir each dipped about 1%, Salesforce fell 2%, Autodesk slid 3%, and the iShares Expanded Tech-Software ETF (IGV) lost 1%—pushing its year-to-date decline to 22%.
That AI disruption worry has been spreading across sectors like software, real estate, trucking, and financial services, helping drive the S&P 500 to its second straight losing week.
The Dow and S&P both logged their fourth down week in the last five, while the Nasdaq stretched its losing streak to five straight—the longest since 2022.
By the close, the indexes clawed back from the early hole and finished slightly green. The saber-rattling tone with Iran softened a bit, and with China out for Lunar New Year plus many U.S. traders returning from the long weekend, liquidity was thin, and follow-through was muted.
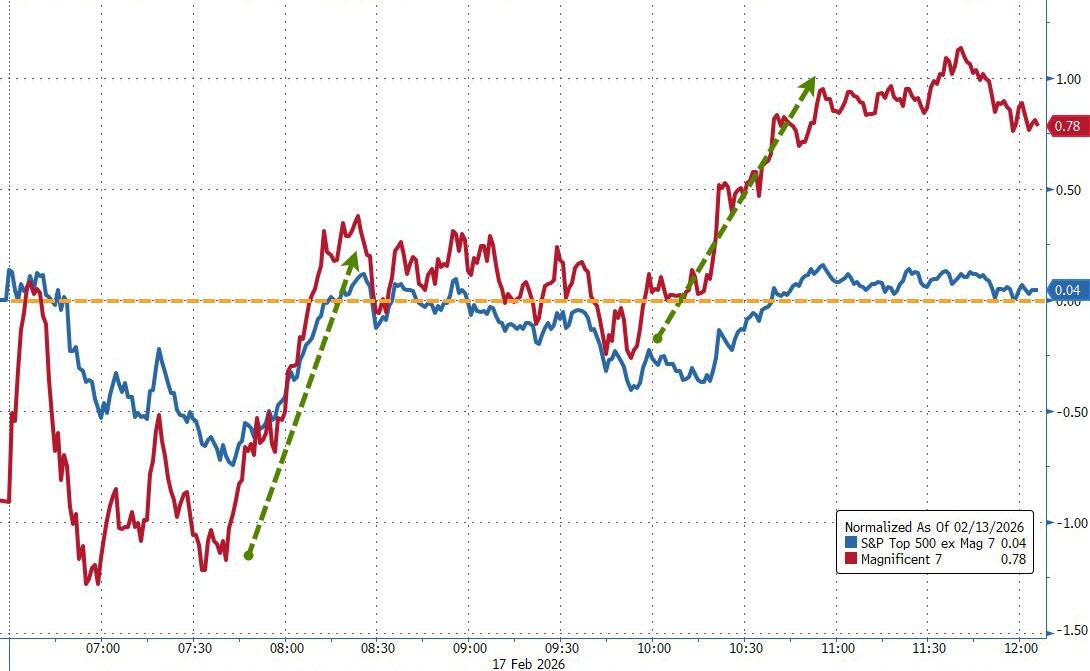
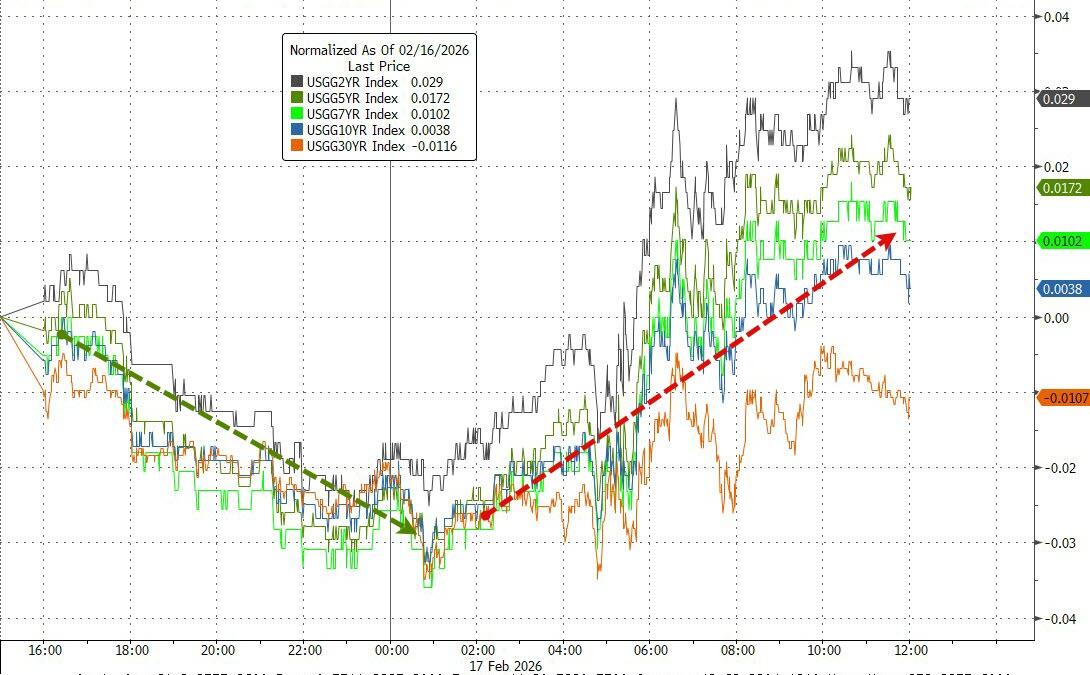
Under the hood, software stocks kept getting hammered, but mega-caps managed to eke out some gains despite rising bond yields.
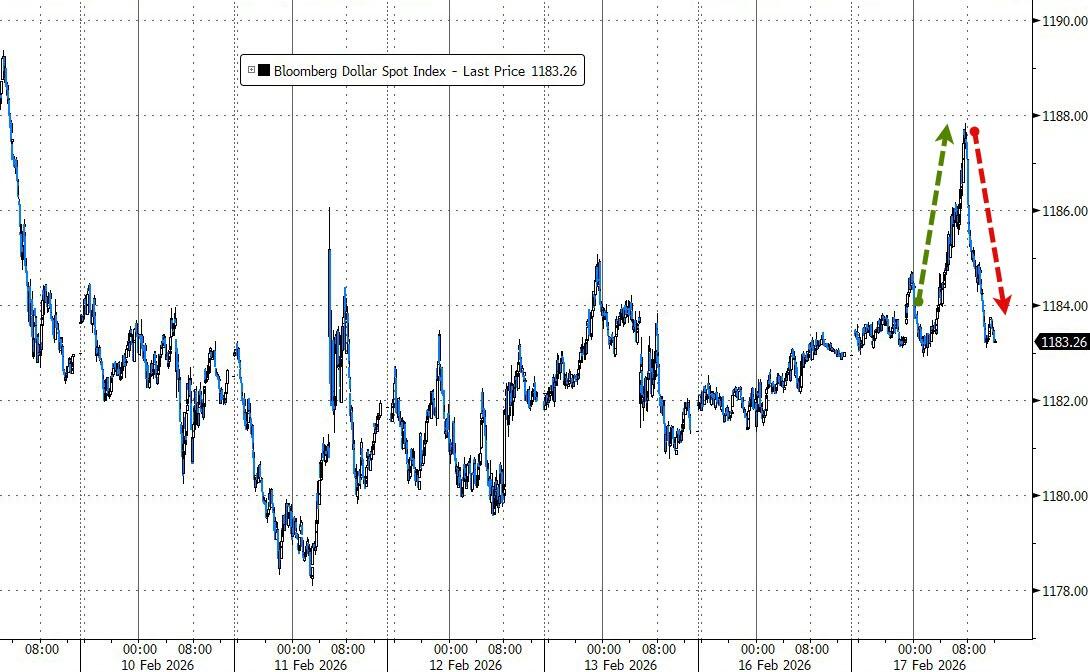
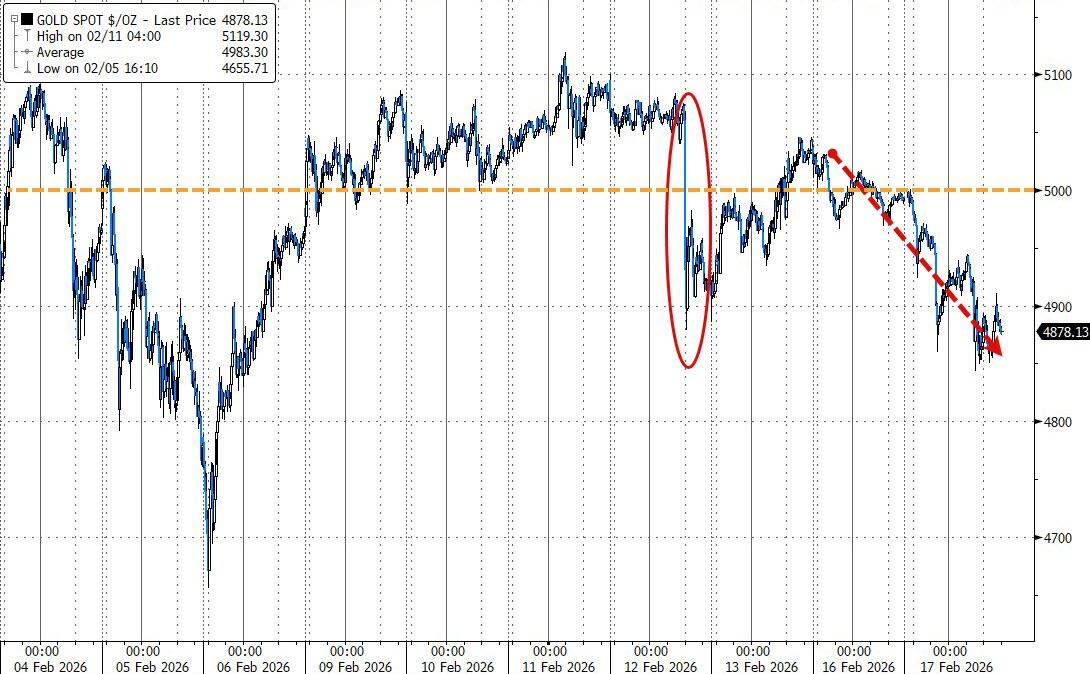
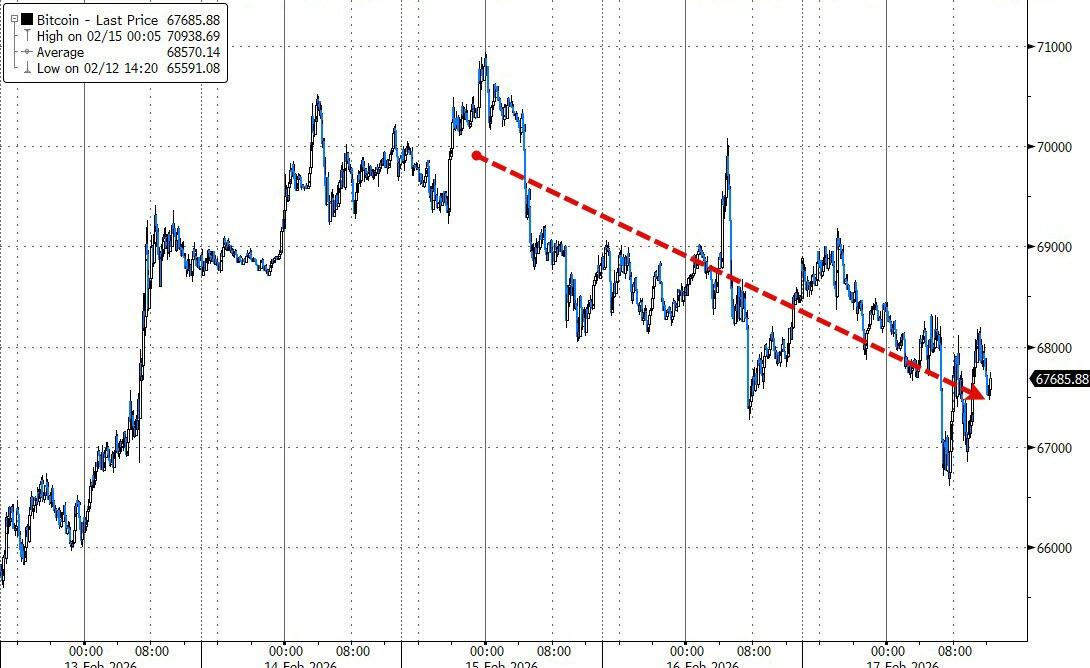
The dollar whipsawed and ended flat, gold lost its grip on $5,000, and Bitcoin pumped early but faded back toward $68K.
When stocks can still close green after a slow start, but metals take a step back, does this feel like a healthy little breather in an otherwise bullish trend… or are we having to watch for signs the broader market might need a stronger catalyst to keep the momentum going?
2. Current domestic “Buy” Cycle (effective 5/20/2025); International “Buy” Cycle (effective 5/8/25)
Our domestic bullish cycle that began on November 21, 2023, concluded on April 3, 2025, following a market downturn triggered by President Trump’s tariff policy announcement.
This development caused significant declines across major indexes and broader market indices. However, markets subsequently rebounded, culminating in a new domestic “Buy” signal taking effect May 20, 2025.
Concurrently, our International Trend Tracking Index (TTI) experienced parallel volatility. On April 4, 2025, it breached critical thresholds, prompting a “Sell” recommendation. This position reversed as global markets recovered, with the International TTI regaining sufficient momentum to issue a new “Buy” signal effective May 8, 2025.
3. Trend Tracking Indexes (TTIs)
Last week’s sluggish vibe carried over, but the major indexes at least shook off an early red start and managed to grind their way to a moderate green close by the end.
Nothing spectacular, but a nice little turnaround from the morning lows.
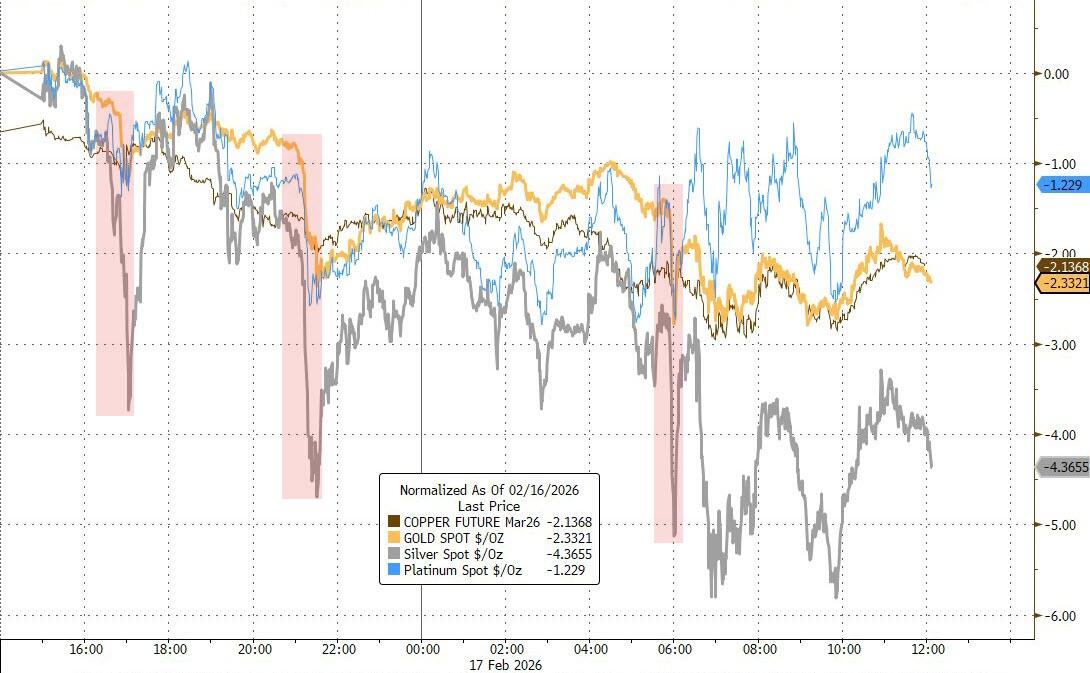
The metals weren’t as lucky—gold, silver, and copper all slipped together today, missing out on the late-session lift.
Our TTIs held up pretty well through the chop—they only gave up a tiny fraction and stayed comfortably in positive territory.
This is how we closed 02/17/2026:
Domestic TTI: +8.06% above its M/A (prior close +8.24%)—Buy signal effective 5/20/25.
International TTI: +12.00% above its M/A (prior close +12.19%)—Buy signal effective 5/8/25.
All linked charts above are courtesy of Bloomberg via ZeroHedge.
———————————————————-
WOULD YOU LIKE TO HAVE YOUR INVESTMENTS PROFESSIONALLY MANAGED?
Do you have the time to follow our investment plans yourself? If you are a busy professional who would like to have his portfolio managed using our methodology, please contact me directly to get more details.
Contact Ulli