
- Moving the market
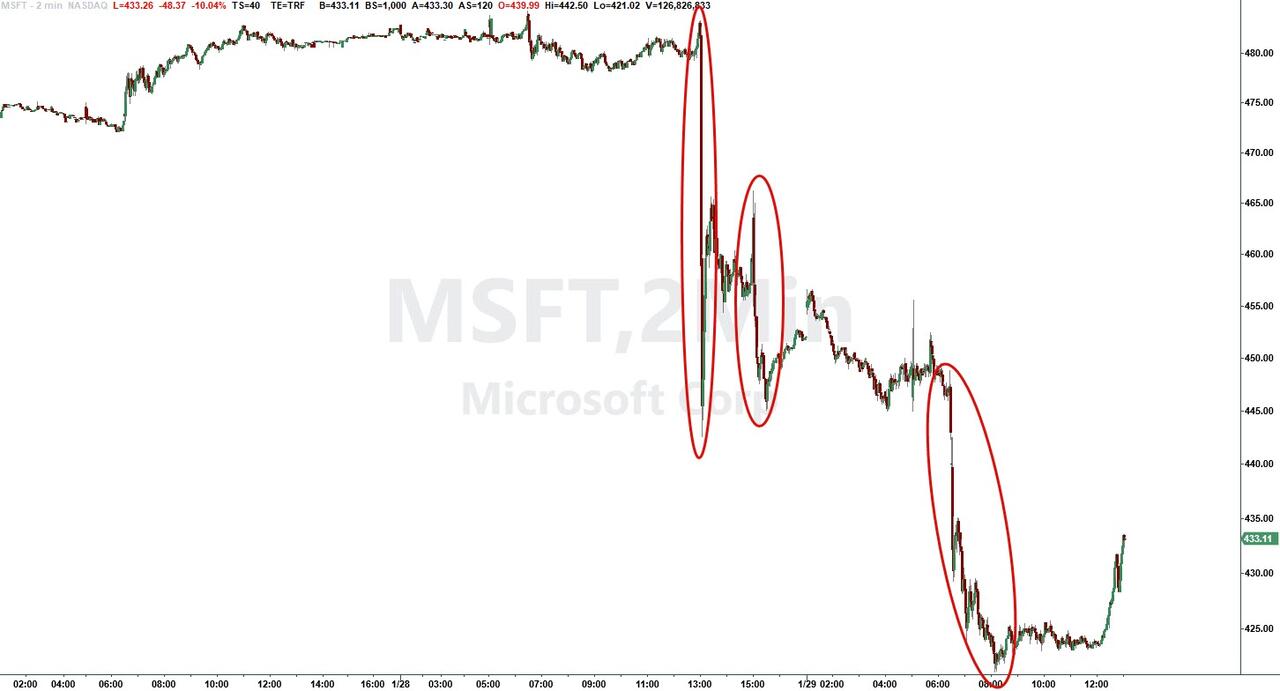
The major indexes opened sharply lower, dragged down hard by Microsoft after its latest earnings miss.
The stock tanked 11%—its worst day since March 2020—on slower cloud growth and soft margin guidance for the next quarter.
That sparked fresh worries that AI might disrupt even Microsoft’s core business model, so software names got hit too: ServiceNow dropped 12% (even after beating estimates), Oracle fell 5%, and Salesforce slid 8%. The Nasdaq took the brunt of the pain early on.
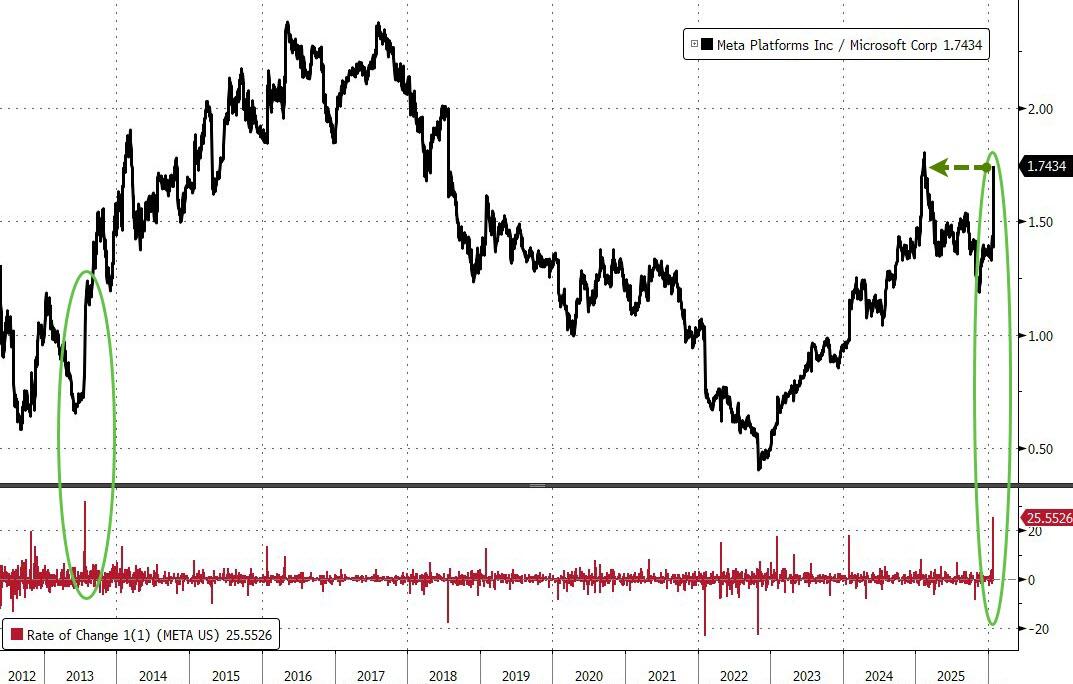
The pressure’s now squarely on Apple (reporting after the bell today). On a brighter note, Meta jumped 7% after a stronger-than-expected Q1 sales outlook.
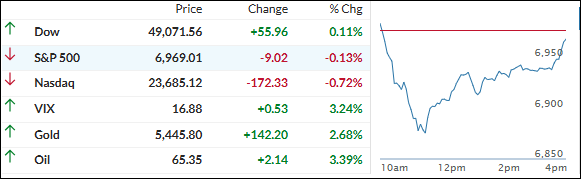
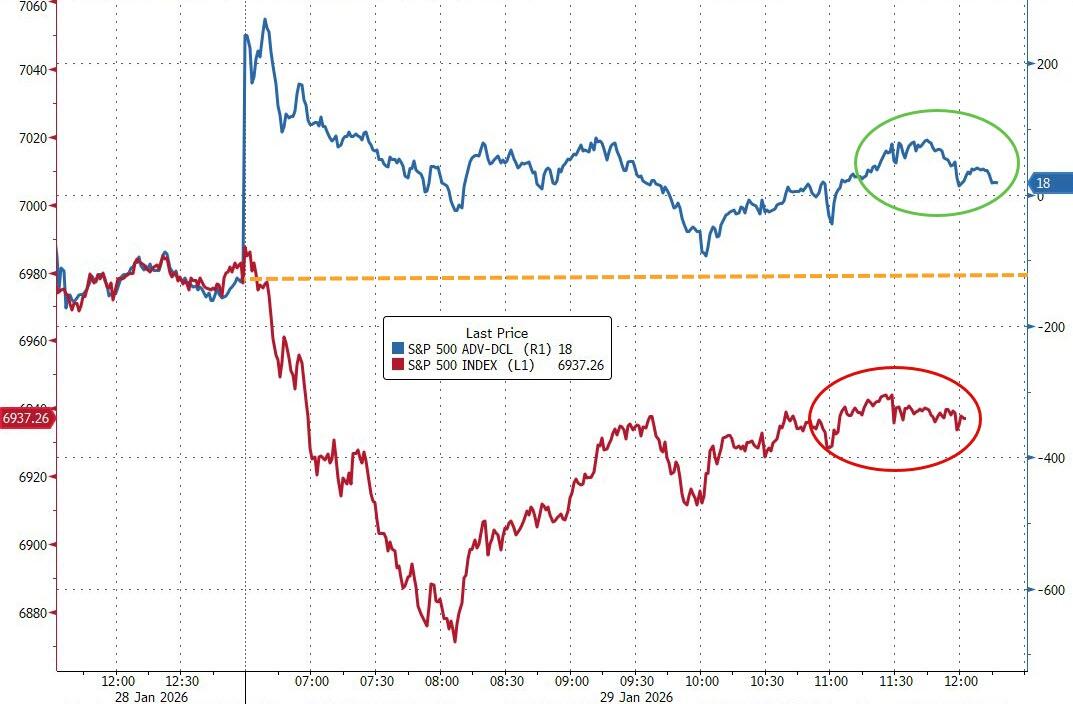
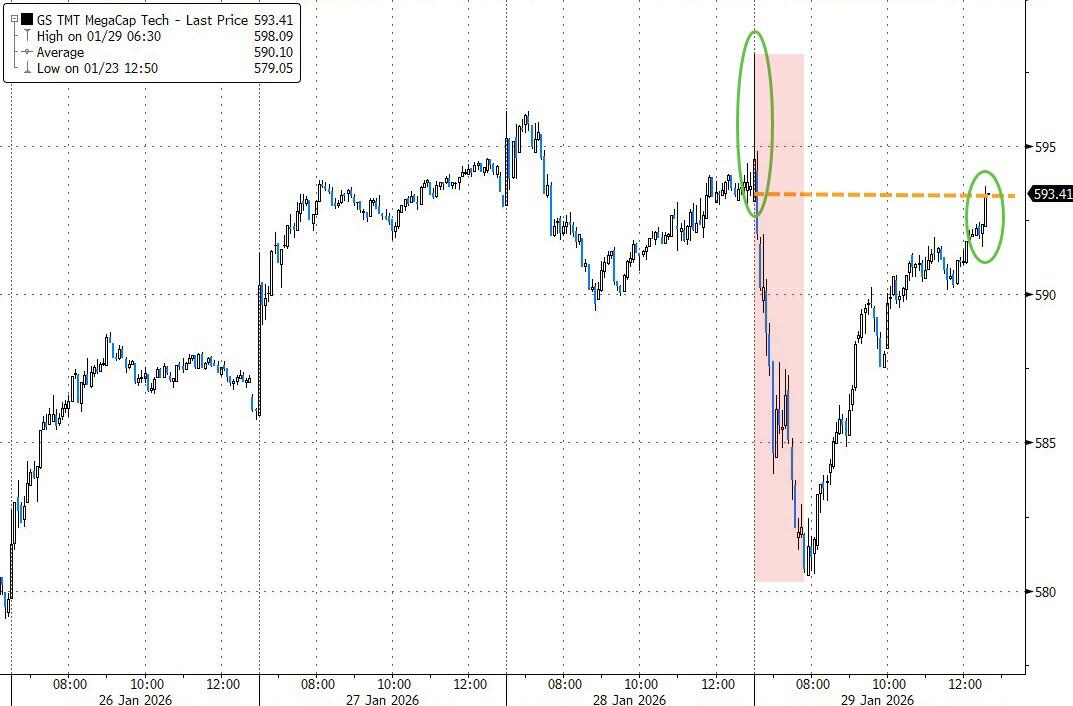
By the close, most of the red sea had been wiped out—the S&P 500 and Nasdaq finished lower but well off their session lows. Breadth actually looked healthy: more stocks up than down, even with mega-tech getting battered early. The Mag 7 bounced back to a green close for the day.
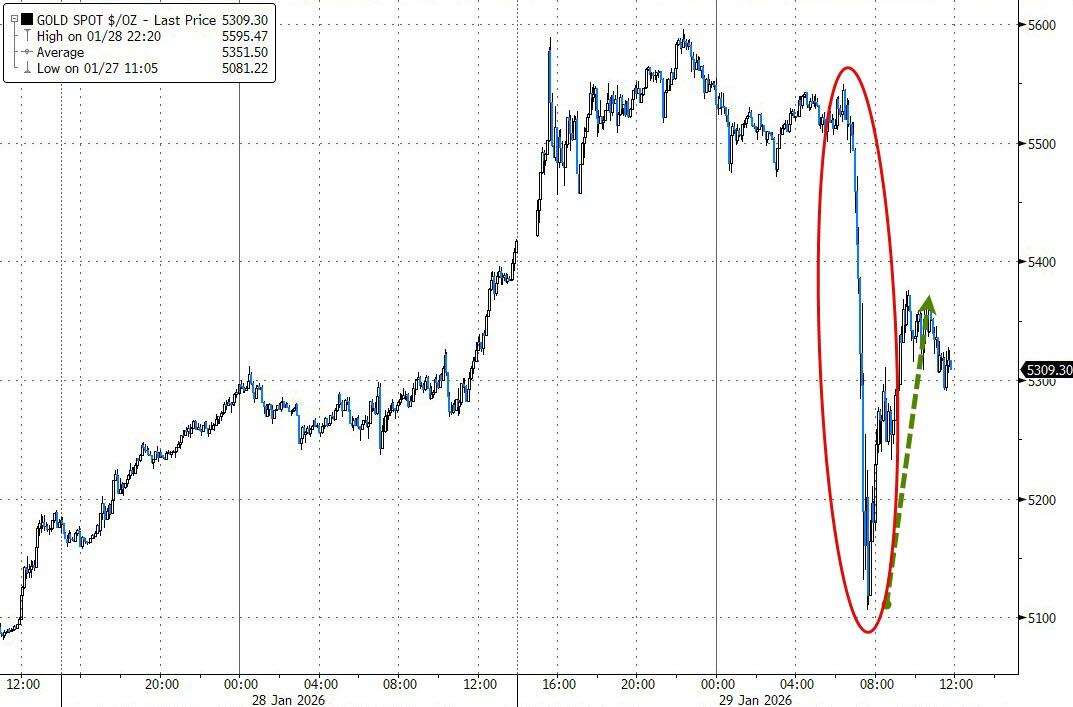
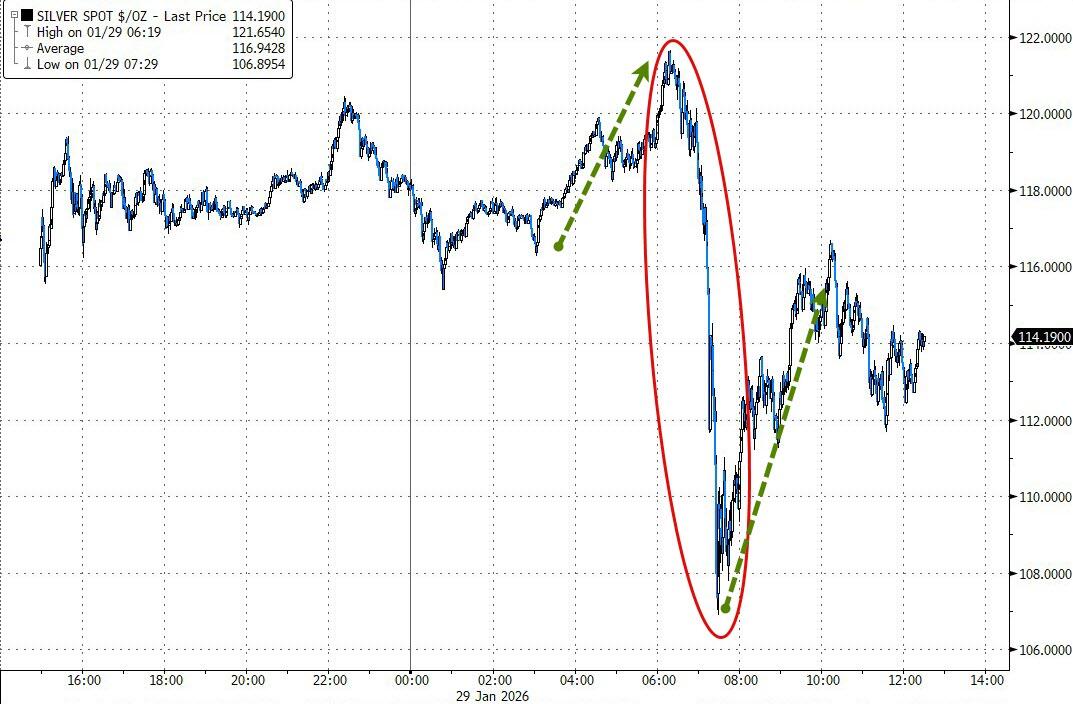
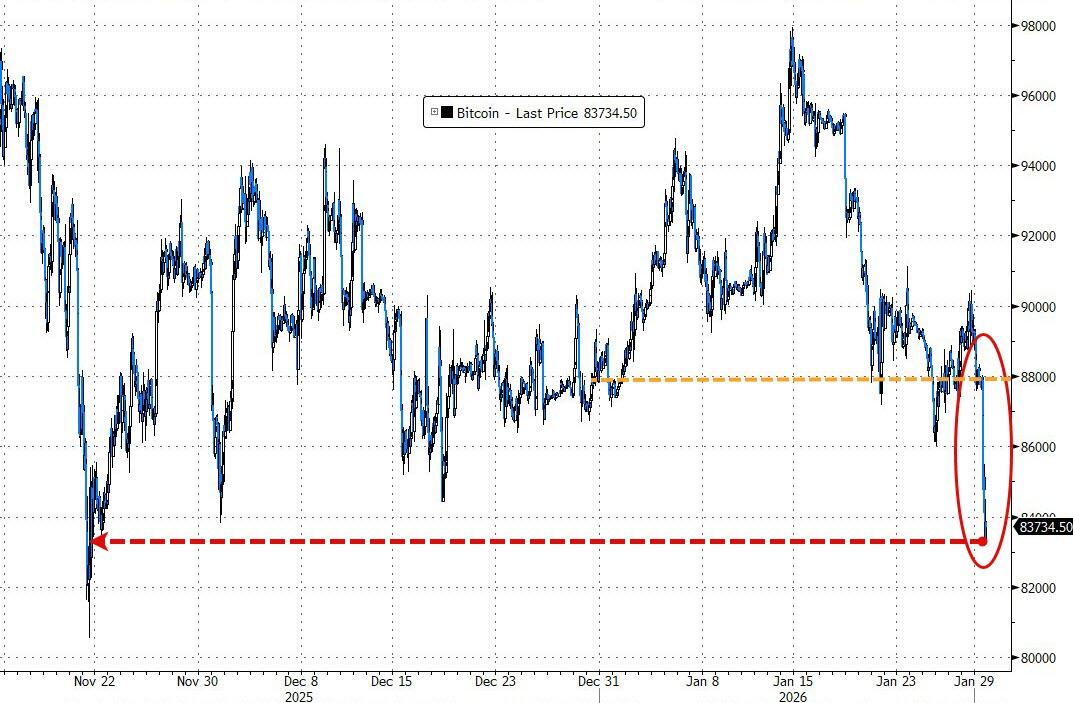
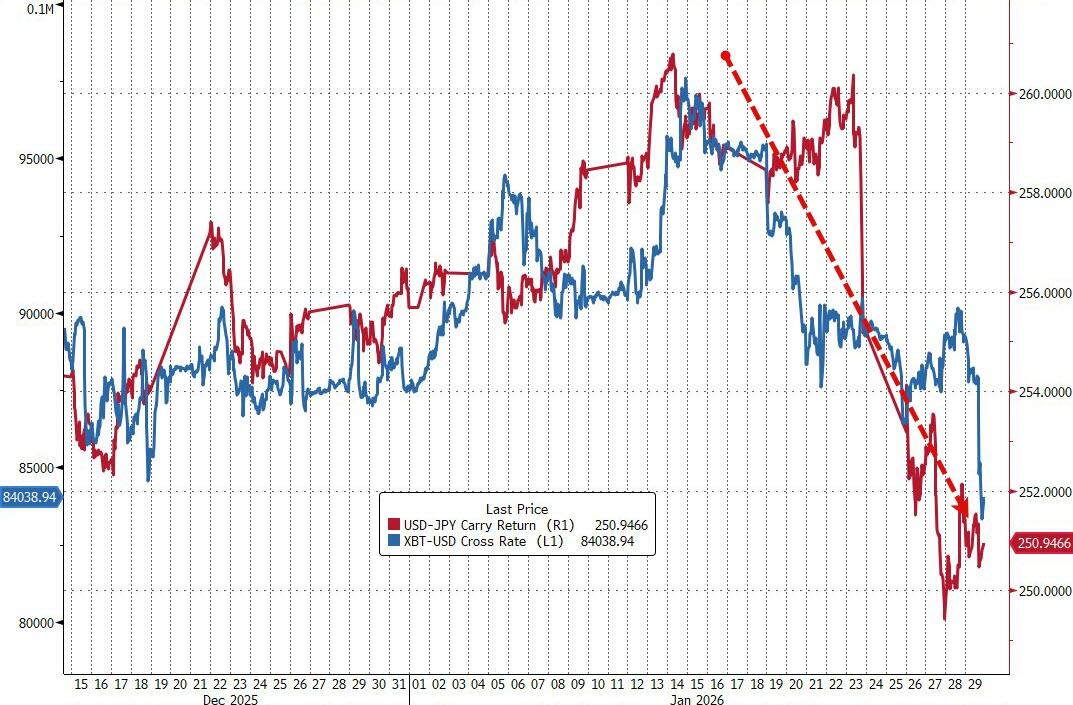
Copper had a wild ride but recovered strongly, gaining over 5% (CPER). Gold (GLD) eked out a modest gain after some chop, silver swung from a high of $122 down to $107 before nearly clawing back to flat, and Bitcoin wasn’t so lucky—dipping to the $84K level and staying there.
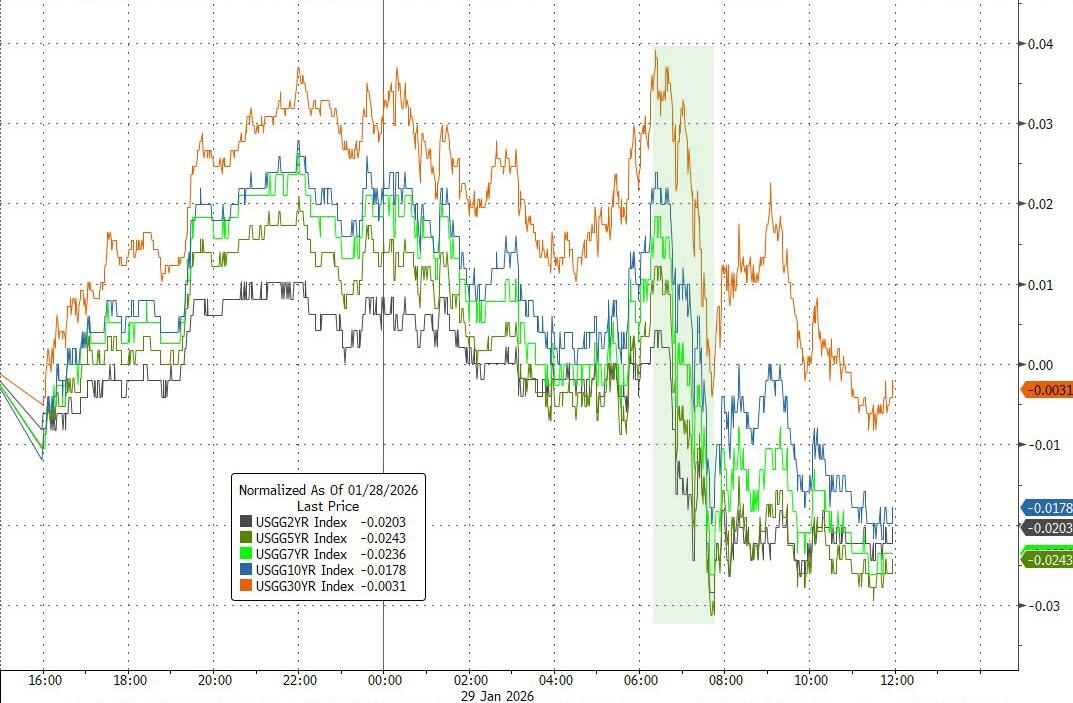
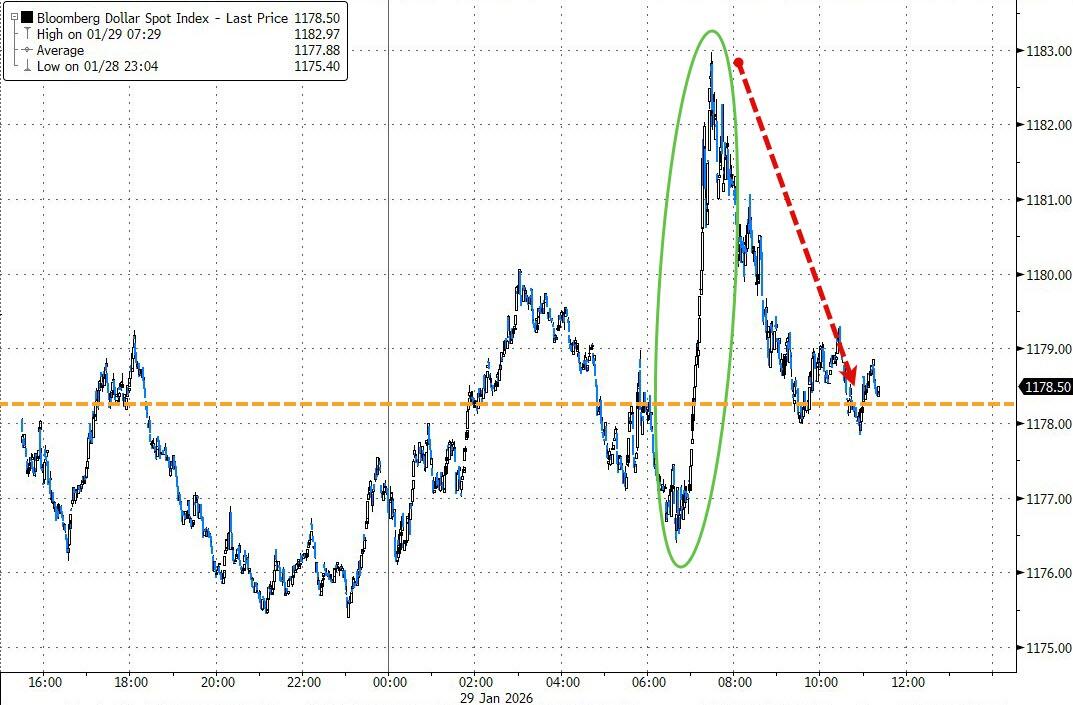
Bond yields slipped, the dollar pumped and dumped to end unchanged. Crypto and risk assets like BTC tend to move with liquidity—when it’s plentiful, they rally; when it tightens (like now, with the yen carry trade unwinding), they pull back.
2. Current domestic “Buy” Cycle (effective 5/20/2025); International “Buy” Cycle (effective 5/8/25)
Our domestic bullish cycle that began on November 21, 2023, concluded on April 3, 2025, following a market downturn triggered by President Trump’s tariff policy announcement.
This development caused significant declines across major indexes and broader market indices. However, markets subsequently rebounded, culminating in a new domestic “Buy” signal taking effect May 20, 2025.
Concurrently, our International Trend Tracking Index (TTI) experienced parallel volatility. On April 4, 2025, it breached critical thresholds, prompting a “Sell” recommendation. This position reversed as global markets recovered, with the International TTI regaining sufficient momentum to issue a new “Buy” signal effective May 8, 2025.
3. Trend Tracking Indexes (TTIs)
The session started ugly—the major indexes plunged right out of the gate, with the Nasdaq leading the downside charge and everything looking pretty grim early on.
But then, out of nowhere, a fresh wave of bullish energy kicked in and yanked the market out of the hole. By the close, the Dow squeaked out a tiny green finish, while the rest of the pack clawed back most of their losses.
The metals felt the early pain too and got dragged lower with stocks, but they staged their own comeback. Gold managed to close with a modest gain, while silver fell just a hair short of turning positive.
Our TTIs showed some real staying power through the chop—they both advanced moderately and kept the positive trend looking solid.
This is how we closed 1/29/2026:
Domestic TTI: +7.17% above its M/A (prior close +7.03%)—Buy signal effective 5/20/25.
International TTI: +11.45% above its M/A (prior close +10.95%)—Buy signal effective 5/8/25.
All linked charts above are courtesy of Bloomberg via ZeroHedge.
———————————————————-
WOULD YOU LIKE TO HAVE YOUR INVESTMENTS PROFESSIONALLY MANAGED?
Do you have the time to follow our investment plans yourself? If you are a busy professional who would like to have his portfolio managed using our methodology, please contact me directly to get more details.
Contact Ulli