
- Moving the market
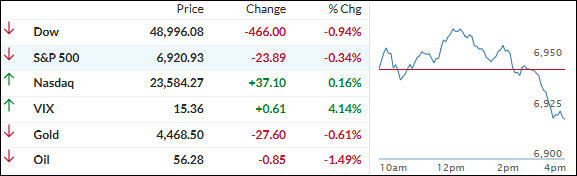
The S&P 500 and Dow kicked things off by flashing fresh all-time intraday highs—building on their hot start to 2026—but the early excitement faded. Both slipped into the red by the close as the rally ran out of gas.
Crude oil took a hit after President Trump mentioned interim Venezuelan authorities could hand over up to 50 million barrels to the U.S., sparking worries about extra supply flooding the market.
Maduro’s arrest is big geopolitically, but it doesn’t change oil flows right now—so markets mostly shrugged. That said, if things get messy with cooperation, elections, or unrest, it could stir up fresh chaos and weigh on stocks.
Economic data was mixed: service-sector activity hit its best level of the year (strong orders and hiring), but job openings plunged in November, with hiring and layoffs both cooling.
In the end, equities finished lower, with only the Nasdaq squeezing out a tiny gain. Bond yields eased, gold and silver dipped but bounced off session lows, and copper plus Bitcoin took a breather too.
With even the metals and crypto joining stocks on the downside after their monster runs, does this feel like a normal, healthy pullback to reset before Friday’s big jobs report… or a little caution flag worth watching ahead of potential swings?
2. Current domestic “Buy” Cycle (effective 5/20/2025); International “Buy” Cycle (effective 5/8/25)
Our domestic bullish cycle that began on November 21, 2023, concluded on April 3, 2025, following a market downturn triggered by President Trump’s tariff policy announcement.
This development caused significant declines across major indexes and broader market indices. However, markets subsequently rebounded, culminating in a new domestic “Buy” signal taking effect May 20, 2025.
Concurrently, our International Trend Tracking Index (TTI) experienced parallel volatility. On April 4, 2025, it breached critical thresholds, prompting a “Sell” recommendation. This position reversed as global markets recovered, with the International TTI regaining sufficient momentum to issue a new “Buy” signal effective May 8, 2025.
3. Trend Tracking Indexes (TTIs)
The day started with some early bullish spark, but that got wiped out pretty quick.
By the close, only the Nasdaq squeaked out a tiny gain—everything else, from the Dow and S&P to small caps, metals, and crypto, finished in the red.
Our TTIs felt the drag too. Both gave back a chunk of their recent wins, with the domestic one taking the bigger hit compared to the international TTI, which held up a little better.
This is how we closed 1/07/2026:
Domestic TTI: +6.78% above its M/A (prior close +7.99%)—Buy signal effective 5/20/25.
International TTI: +10.25% above its M/A (prior close +10.92%)—Buy signal effective 5/8/25.
All linked charts above are courtesy of Bloomberg via ZeroHedge.
———————————————————-
WOULD YOU LIKE TO HAVE YOUR INVESTMENTS PROFESSIONALLY MANAGED?
Do you have the time to follow our investment plans yourself? If you are a busy professional who would like to have his portfolio managed using our methodology, please contact me directly to get more details.
Contact Ulli