
ETF Tracker StatSheet
You can view the latest version here. (next update 1/8/26)
BITCOIN OVER $90K, METALS FLAT – SHORT SQUEEZE POWERS SMALL CAPS
- Moving the market
The new year kicked off with a “mixed bag” vibe that pretty much summed up the whole session.
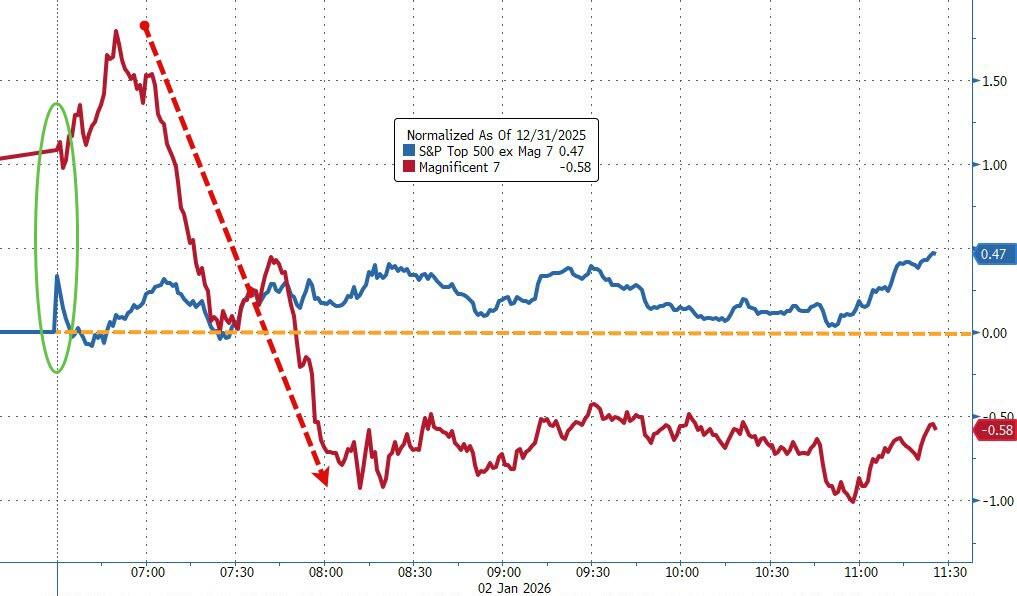
Big-tech names started strong overnight but got hammered as the day wore on, flipping from solid gains to afternoon losses.
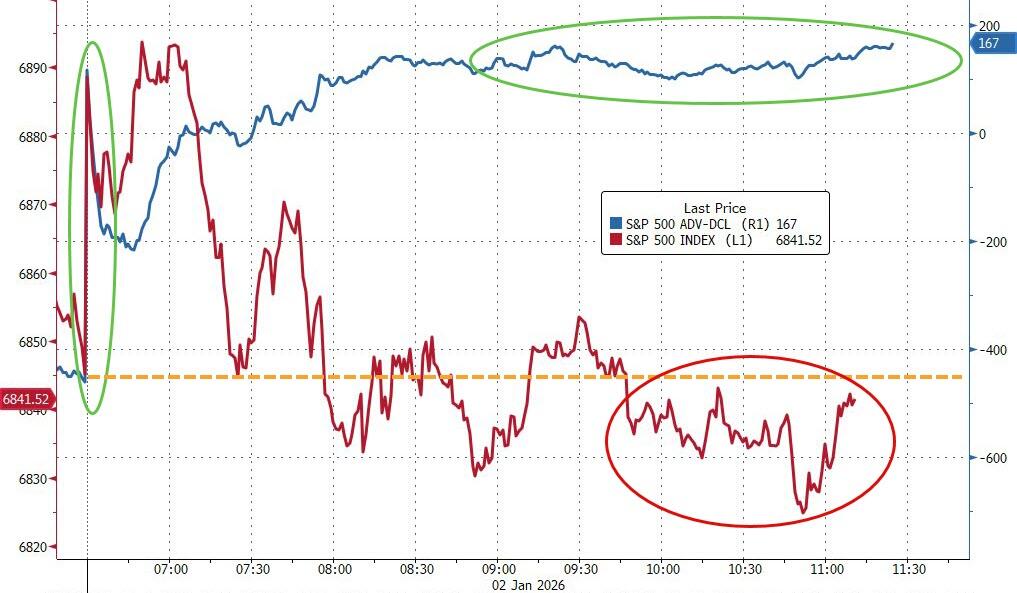
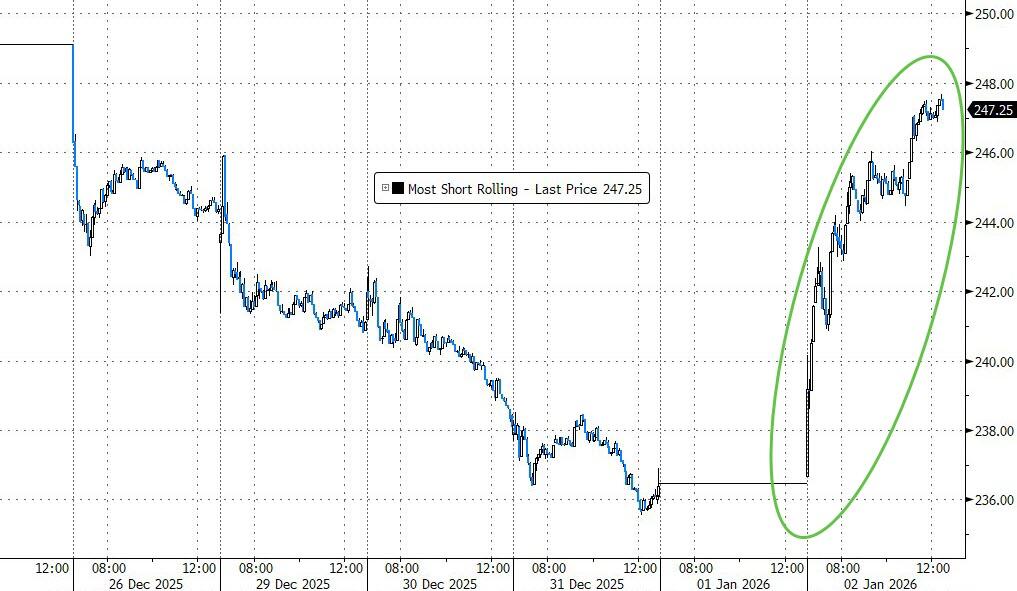
The Mag 7 basket took the biggest beating, while the other 493 S&P names (and the broad market) held up way better—breadth was super positive, helped by a massive short squeeze.
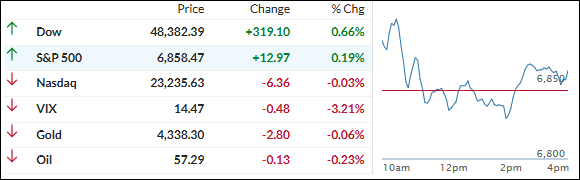
The Nasdaq summed up the chaos perfectly: up 1.2% right out of the gate, only to fade all day and close down a hair at -0.03%—its low of the session. Small caps were the real winners, and the S&P 500 scraped together a last-hour push to finish slightly green.
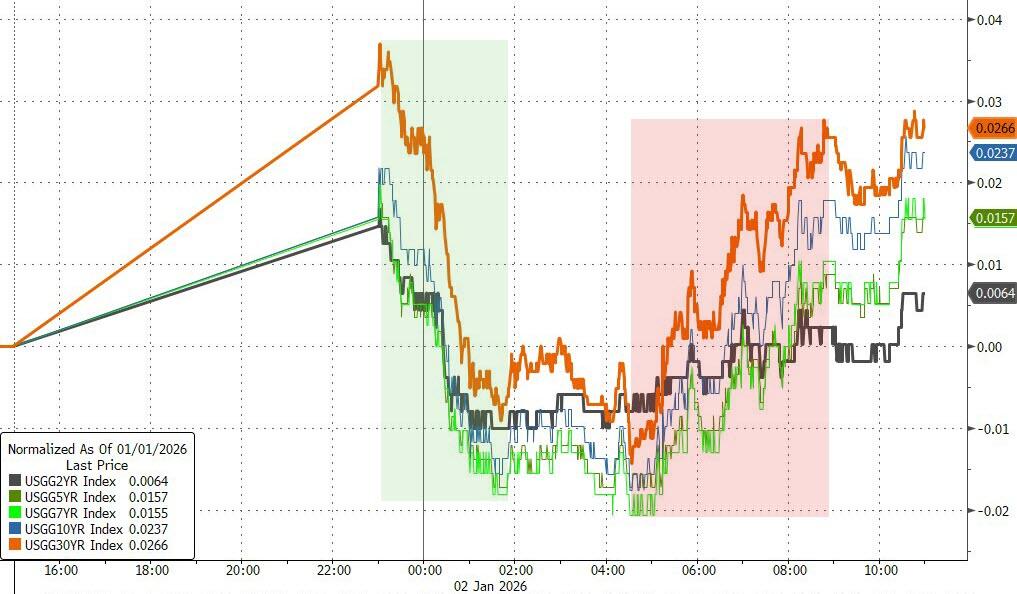
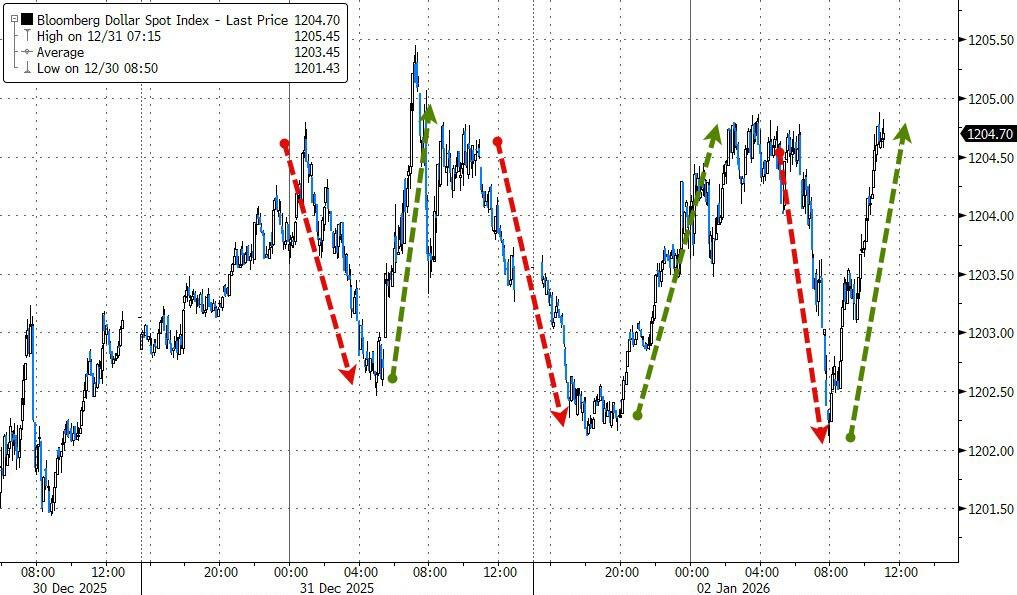
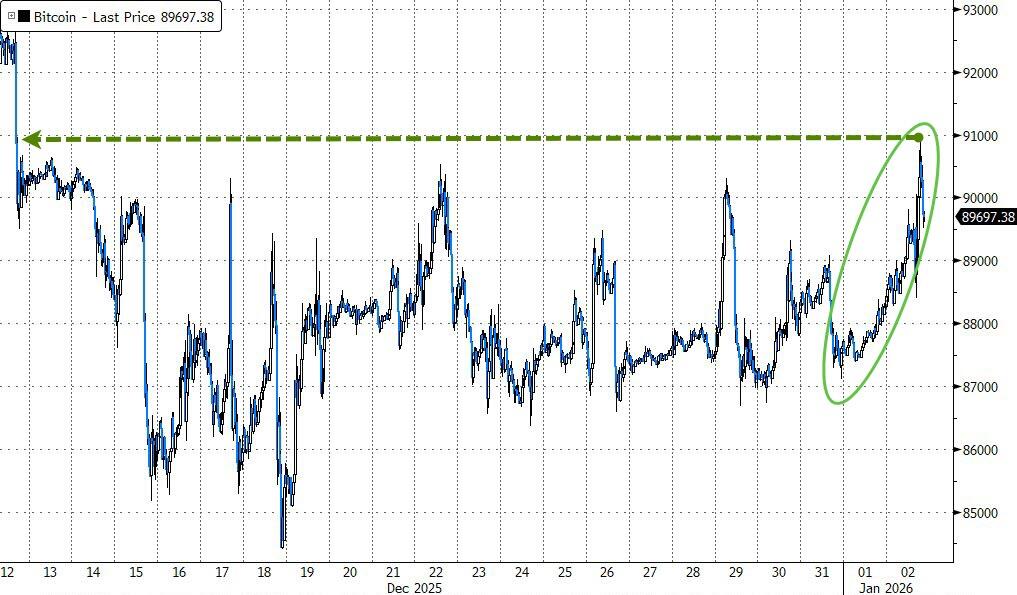
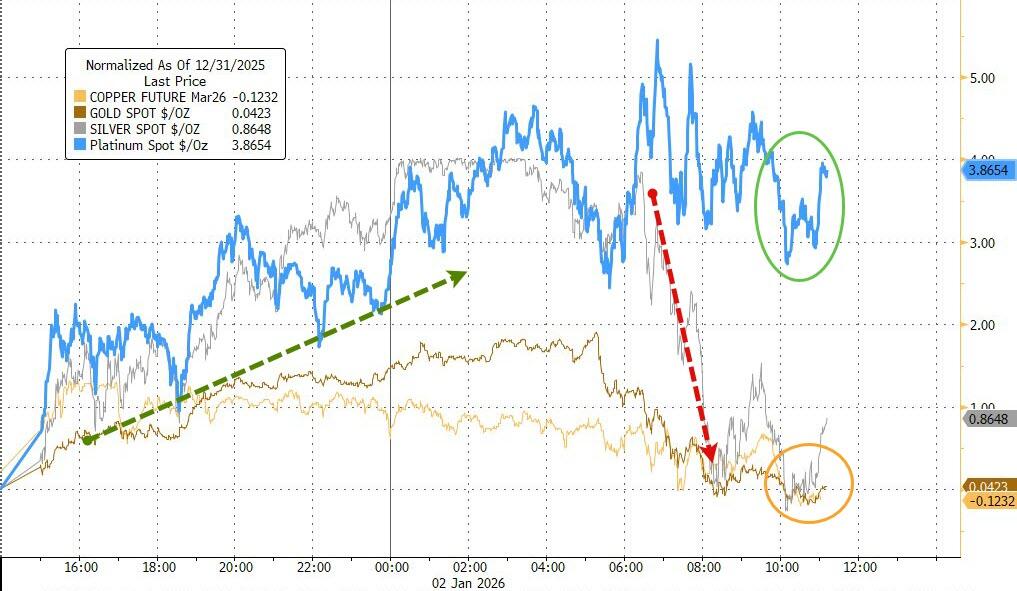
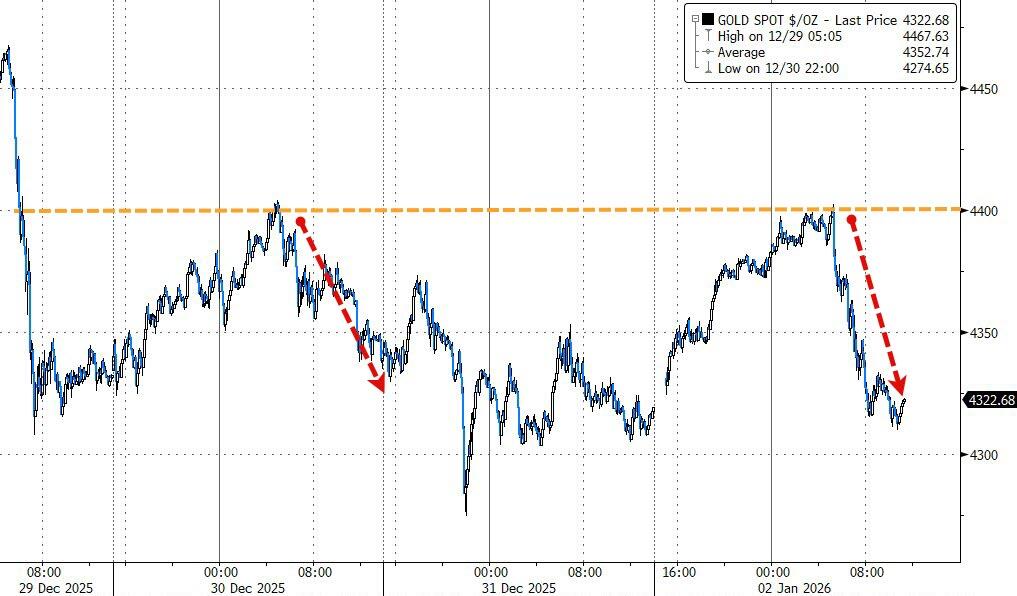
Bond yields and the dollar climbed, Bitcoin had a solid day (broke above $90K and hit near 3-week highs), but metals rode a rollercoaster—rallied overnight, touched highs like gold at$4,400, then gave most of it back to close basically flat.
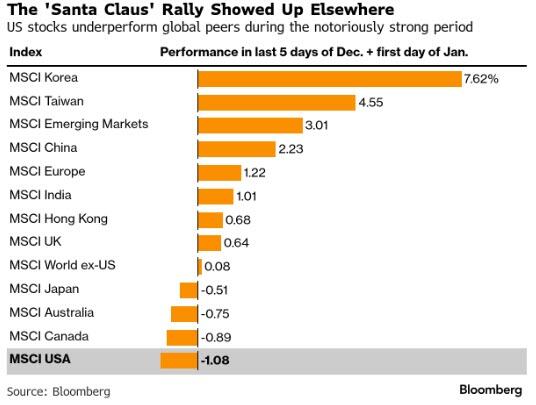
All told, the classic “Santa Claus rally” (last five days of the year + first two of the new) didn’t really show up this time—U.S. stocks lagged global peers during what’s usually a strong stretch.
2. Current domestic “Buy” Cycle (effective 5/20/2025); International “Buy” Cycle (effective 5/8/25)
Our domestic bullish cycle that began on November 21, 2023, concluded on April 3, 2025, following a market downturn triggered by President Trump’s tariff policy announcement.
This development caused significant declines across major indexes and broader market indices. However, markets subsequently rebounded, culminating in a new domestic “Buy” signal taking effect May 20, 2025.
Concurrently, our International Trend Tracking Index (TTI) experienced parallel volatility. On April 4, 2025, it breached critical thresholds, prompting a “Sell” recommendation. This position reversed as global markets recovered, with the International TTI regaining sufficient momentum to issue a new “Buy” signal effective May 8, 2025.
3. Trend Tracking Indexes (TTIs)
We kicked off with some nice early momentum—things were looking green and hopeful. But that fizzled out fast.
The Nasdaq got hit hardest and flipped into the red, while the broader market (small caps, cyclicals, value) held up pretty well and kept losses small.
The metals were all over the place—classic whipsaw action with big swings both ways before settling mixed.
Our domestic TTI shrugged off the noise and stayed solid, finishing with a modest positive close. Nice to see it hanging tough.
This is how we closed 1/02/2026:
Domestic TTI: +5.72% above its M/A (prior close +5.56%)—Buy signal effective 5/20/25.
International TTI: +9.34% above its M/A (prior close +9.57%)—Buy signal effective 5/8/25.
All linked charts above are courtesy of Bloomberg via ZeroHedge.
———————————————————-
WOULD YOU LIKE TO HAVE YOUR INVESTMENTS PROFESSIONALLY MANAGED?
Do you have the time to follow our investment plans yourself? If you are a busy professional who would like to have his portfolio managed using our methodology, please contact me directly to get more details.
Contact Ulli