
- Moving the market
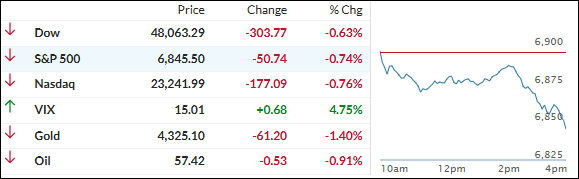
Stocks pulled back a bit today, extending a three-session losing streak, but the declines stayed pretty mild.
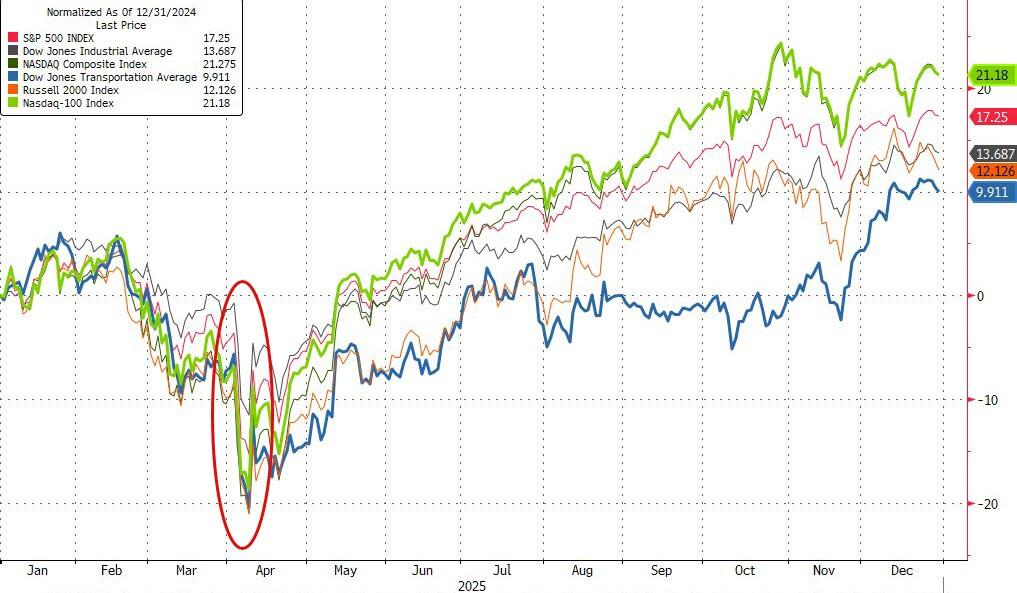
The S&P 500 still locked in a solid 16.8% gain for the year—its third straight double-digit win. The Nasdaq rode the AI wave to +20.8%, while the Dow lagged a touch at +13% (not as much tech juice).
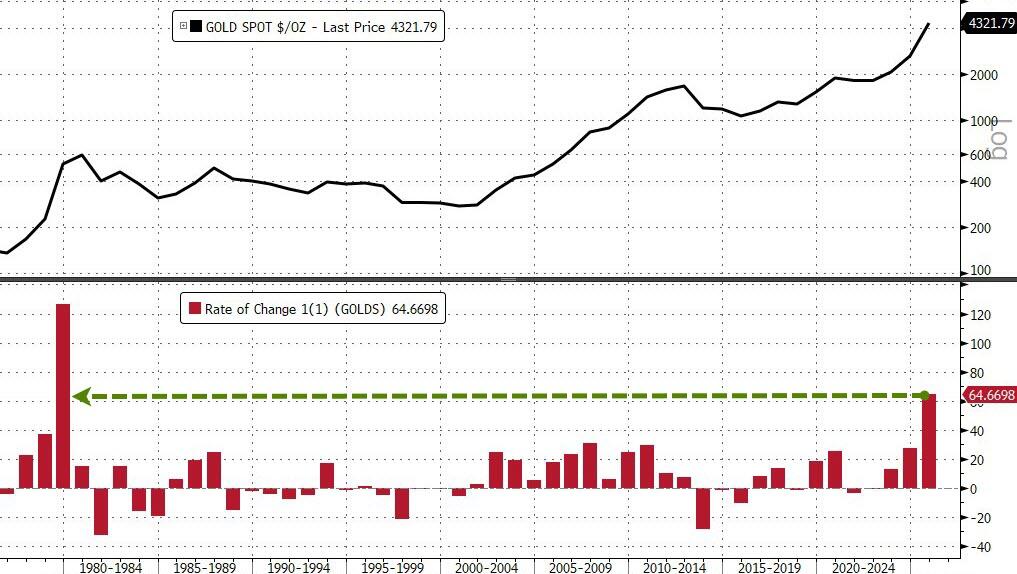
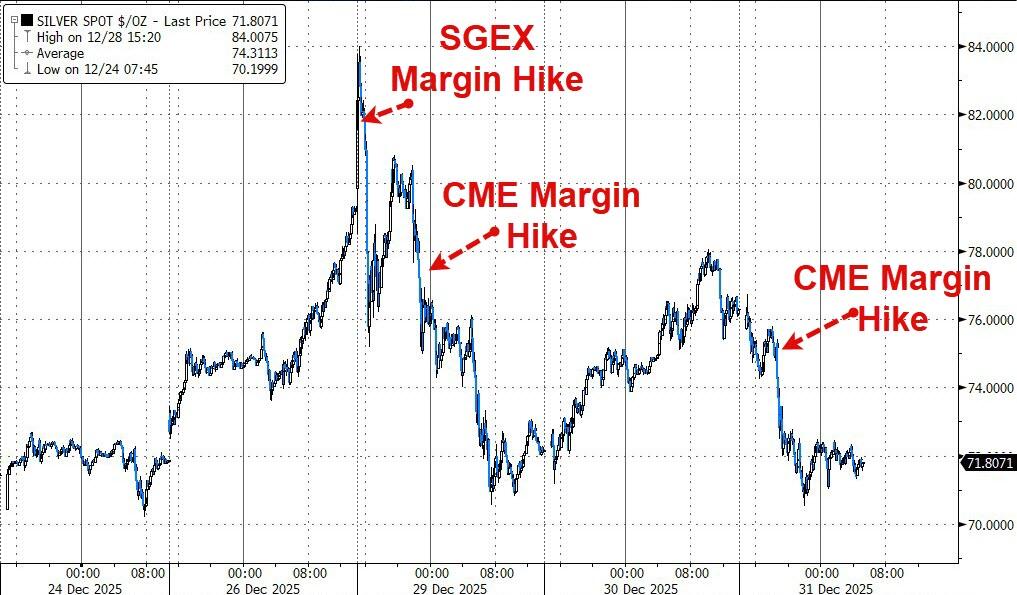
But the real champions? Precious metals crushed it: silver exploded +143% (its best year since the ’70s), and gold delivered a hefty +64%.
We’ve come a long way from that scary April rout after Trump’s big tariff announcement—the S&P flirted with bear territory (down almost 19% from its February peak and dipping below 5,000). Today’s dip feels like a gentle exhale after that comeback.
The recent softness is a little eyebrow-raising, though, since we’re smack in the middle of the “Santa Claus rally” window (last five days of the year + first two of the next)—usually a nice year-end gift.
Plus, the late pullback in metals came from exchanges hiking margin requirements, forcing leveraged players to liquidate, and creating some forced selling.
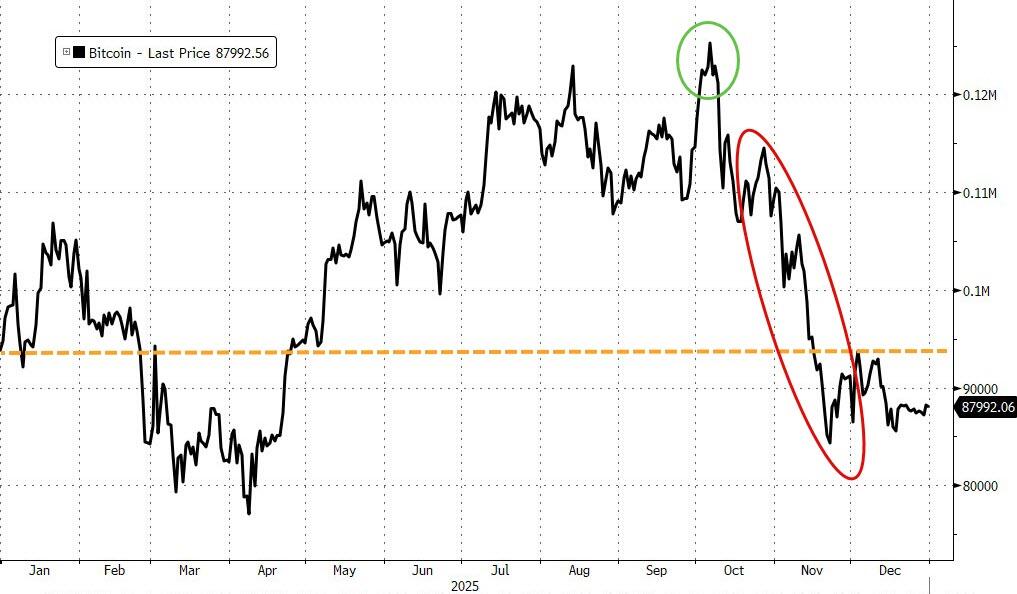
Bitcoin had a tougher finish: hit $126K in October but lost steam and closed the year down about 6%—its worst since 2022.
Looking ahead, the macro setup for 2026 still looks supportive—global growth around 2.8%, Fed easing, and big capex spending—but valuations have never been this stretched.
Stocks could grind another double-digit year, but a lot of folks think we might spend time chopping sideways while earnings catch up.
Happy New Year—here’s to a healthy, prosperous 2026!
Continue reading…
2. Current domestic “Buy” Cycle (effective 5/20/2025); International “Buy” Cycle (effective 5/8/25)
Our domestic bullish cycle that began on November 21, 2023, concluded on April 3, 2025, following a market downturn triggered by President Trump’s tariff policy announcement.
This development caused significant declines across major indexes and broader market indices. However, markets subsequently rebounded, culminating in a new domestic “Buy” signal taking effect May 20, 2025.
Concurrently, our International Trend Tracking Index (TTI) experienced parallel volatility. On April 4, 2025, it breached critical thresholds, prompting a “Sell” recommendation. This position reversed as global markets recovered, with the International TTI regaining sufficient momentum to issue a new “Buy” signal effective May 8, 2025.
3. Trend Tracking Indexes (TTIs)
It felt like most traders checked out early for New Year’s—bullish energy was basically nowhere to be found.
Pretty much everything drifted lower, with the major indexes posting their fourth straight daily loss. Even the metals sector, which has been our hero all year, got dragged down with the tide.
No big surprise, our TTIs headed south too, giving back a bit of ground. That said, they closed the year still comfortably in positive territory, so our overall bullish outlook stays fully intact heading into 2026.
This is how we closed 12/31/2025:
Domestic TTI: +5.56% above its M/A (prior close +6.47%)—Buy signal effective 5/20/25.
International TTI: +9.57% above its M/A (prior close +10.03%)—Buy signal effective 5/8/25.
All linked charts above are courtesy of Bloomberg via ZeroHedge.
———————————————————-
WOULD YOU LIKE TO HAVE YOUR INVESTMENTS PROFESSIONALLY MANAGED?
Do you have the time to follow our investment plans yourself? If you are a busy professional who would like to have his portfolio managed using our methodology, please contact me directly to get more details.
Contact Ulli