

- Moving the market
Stocks bounced around the flat line early in the day as investors braced for pivotal Nvidia earnings and the first jobs report since the government shutdown, but things turned south into the close as negative sentiment took over.
While Alphabet popped 5% on news that Berkshire Hathaway took a stake in the tech giant, it wasn’t enough to turn the tide for the broader market, with major averages breaking through key technical support and closing solidly in the red.
Many on Wall Street took comfort in Alphabet’s strength, viewing it as a vote of confidence in the AI narrative from Berkshire’s stock-picking crew, though Warren Buffett himself likely wasn’t behind the move.
Nvidia drifted lower ahead of its big report, and the rest of the artificial intelligence trade followed suit, as worries about stretched valuations lingered.
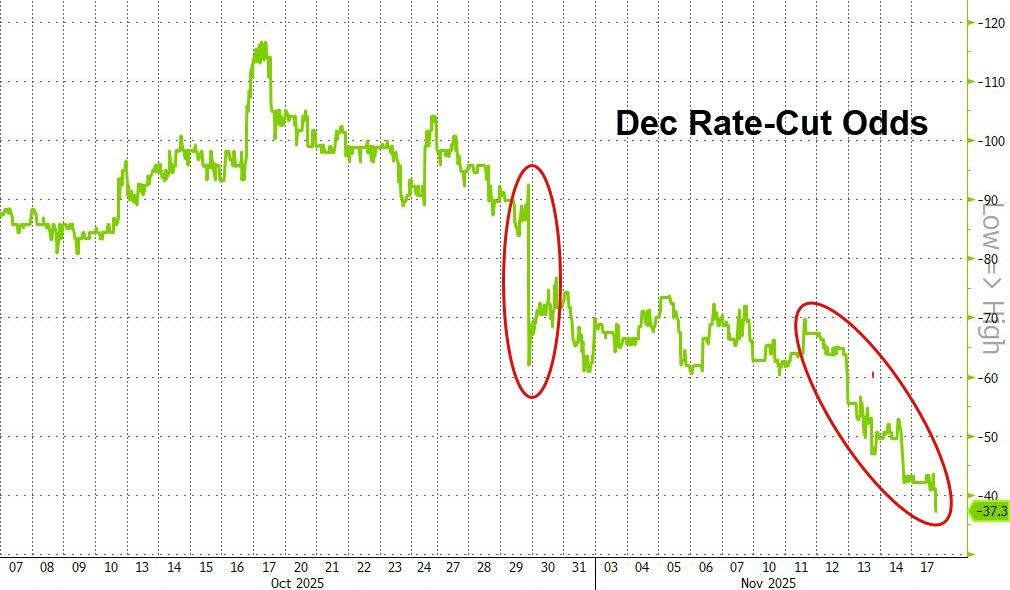
Rate cut odds for December slipped again after stronger-than-expected NY Manufacturing data and an uptick in construction spending.
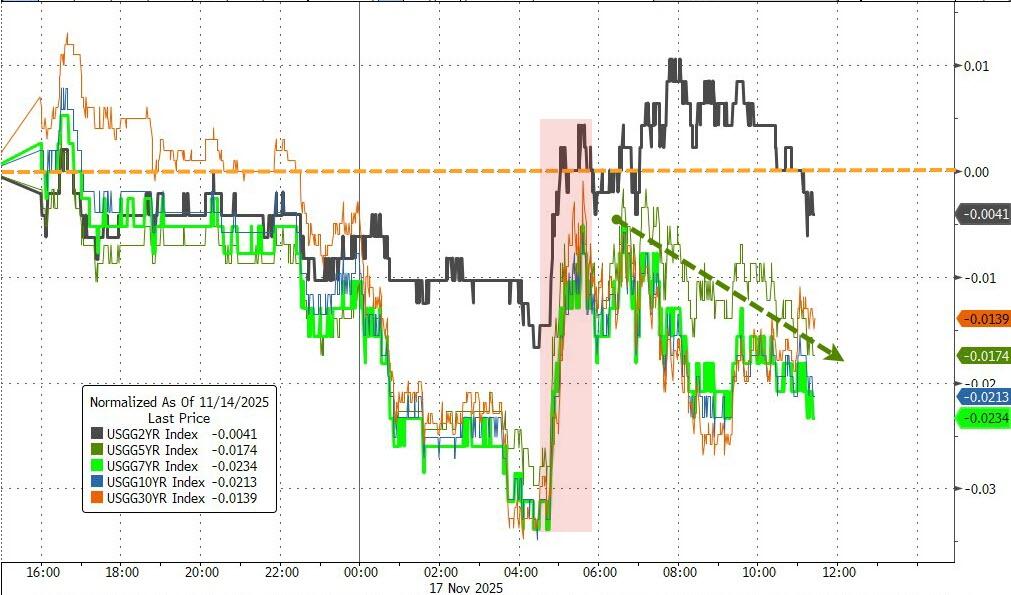
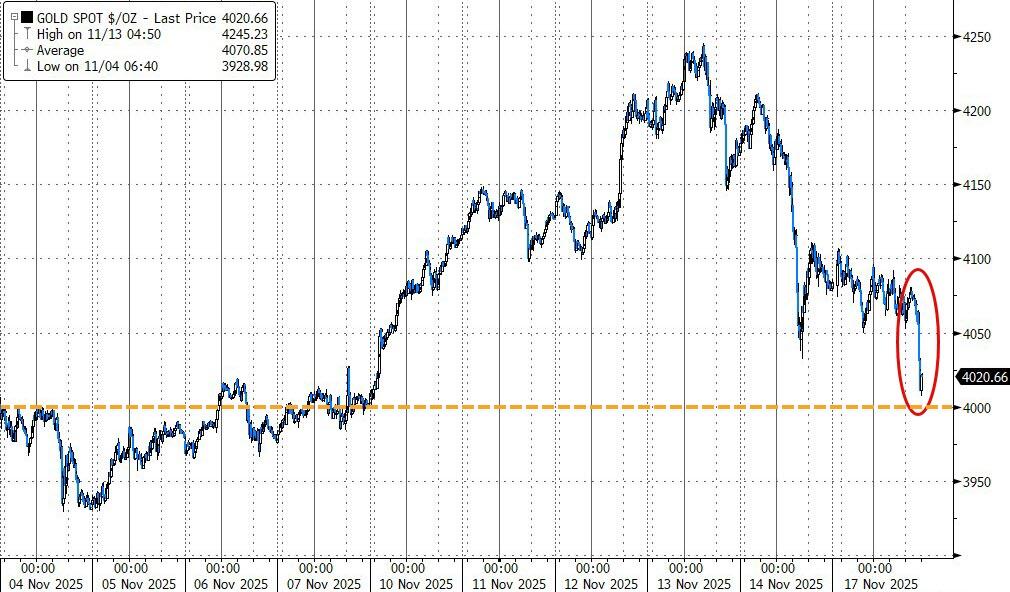
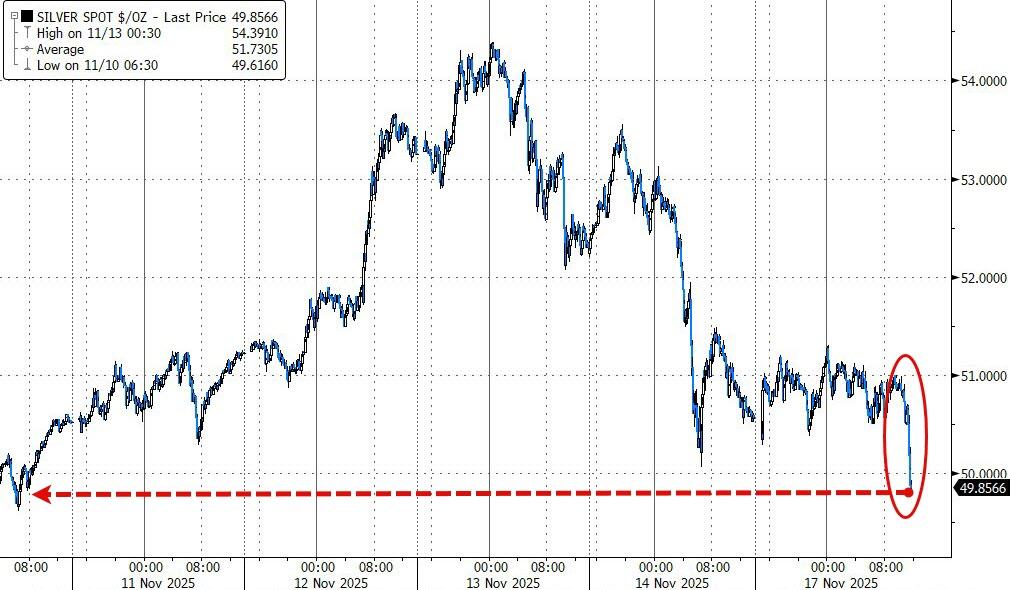
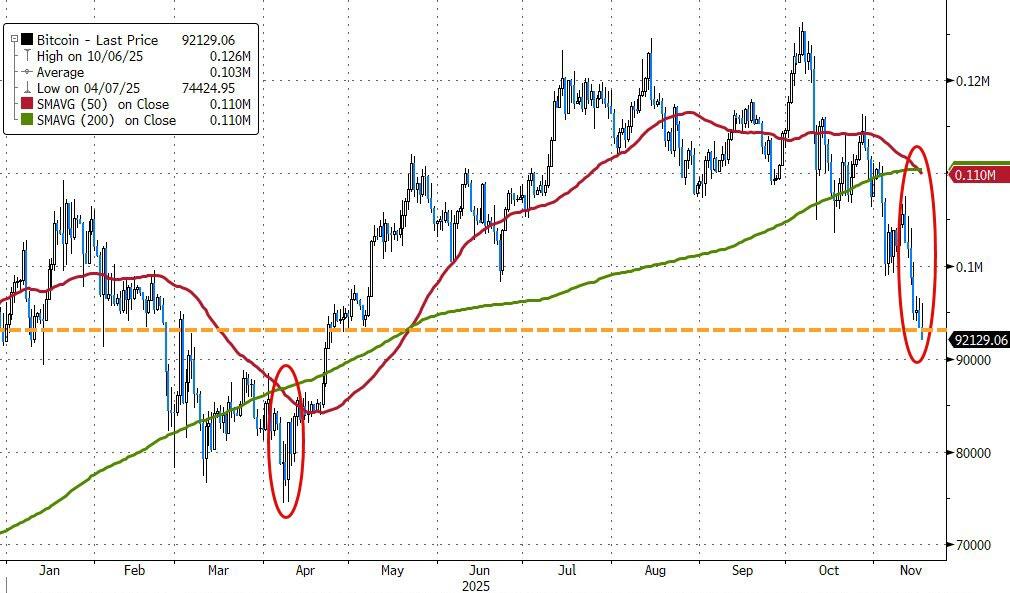
The dollar bounced back, yields eased only slightly, and gold and silver both lost ground, with the yellow metal finding support around $4,000. Bitcoin kept falling, triggering a bearish “death cross” but, as history reminds us, that sometimes marks a bottom.
Will this gloomy tone reverse if Nvidia or the jobs data delivers a positive surprise, or are we in for another choppy ride as the year winds down?
2. Current domestic “Buy” Cycle (effective 5/20/2025); International “Buy” Cycle (effective 5/8/25)
Our domestic bullish cycle that began on November 21, 2023, concluded on April 3, 2025, following a market downturn triggered by President Trump’s tariff policy announcement.
This development caused significant declines across major indexes and broader market indices. However, markets subsequently rebounded, culminating in a new domestic “Buy” signal taking effect May 20, 2025.
Concurrently, our International Trend Tracking Index (TTI) experienced parallel volatility. On April 4, 2025, it breached critical thresholds, prompting a “Sell” recommendation. This position reversed as global markets recovered, with the International TTI regaining sufficient momentum to issue a new “Buy” signal effective May 8, 2025.
3. Trend Tracking Indexes (TTIs)
Despite the major indexes bouncing around their respective flat lines for most of the day, sour sentiment ultimately got the upper hand, and stocks slipped lower into the close.
What really kept investors on edge was the way some “good” data increased worries about fewer Fed rate cuts in December, sending those odds down again and pressuring risk assets across the board.
Gold and other metals also headed south, erasing their safe-haven appeal, so there really was no place to hide.
Both our Domestic and International TTIs felt the pain too, but the good news is they’re still clinging above their trend lines—at least for now.
The Domestic TTI lagged, highlighting how U.S. sectors were hardest hit.
This is how we closed 11/17/2025:
Domestic TTI: +3.05% above its M/A (prior close +4.45%)—Buy signal effective 5/20/25.
International TTI: +8.84% above its M/A (prior close +9.91%)—Buy signal effective 5/8/25.
All linked charts above are courtesy of Bloomberg via ZeroHedge.
———————————————————-
WOULD YOU LIKE TO HAVE YOUR INVESTMENTS PROFESSIONALLY MANAGED?
Do you have the time to follow our investment plans yourself? If you are a busy professional who would like to have his portfolio managed using our methodology, please contact me directly to get more details.
Contact Ulli