
- Moving the market
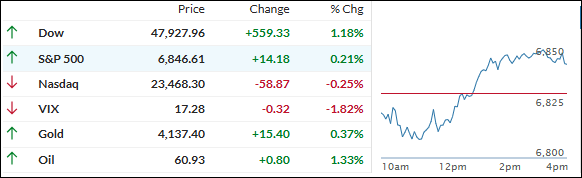
The S&P 500 and Nasdaq stumbled in early trading, weighed down by weak tech performance after the recent surge.
By the close, the S&P 500 clawed back to green, while the Dow powered to a fresh record high.
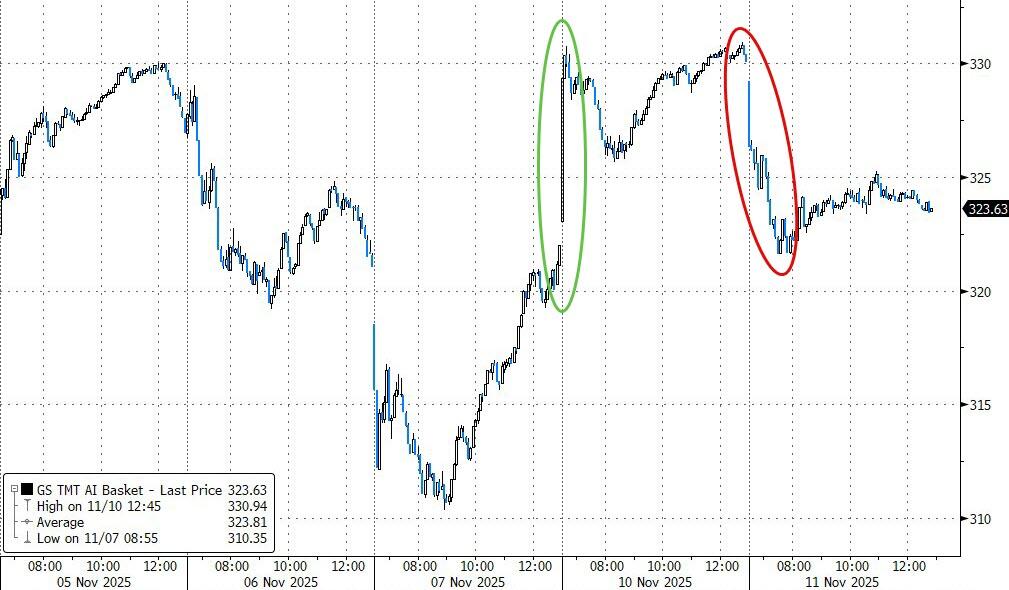
The Nasdaq wasn’t so lucky, finishing with a moderate loss as big names in artificial intelligence—like Nvidia, CoreWeave, Micron Technology, Oracle, and Palantir Technologies—sold off amid growing worries about peaked valuations.
Pressure increased after SoftBank sold its entire Nvidia stake for $5.8 billion, spooking traders who were already on edge about lofty prices in the sector.
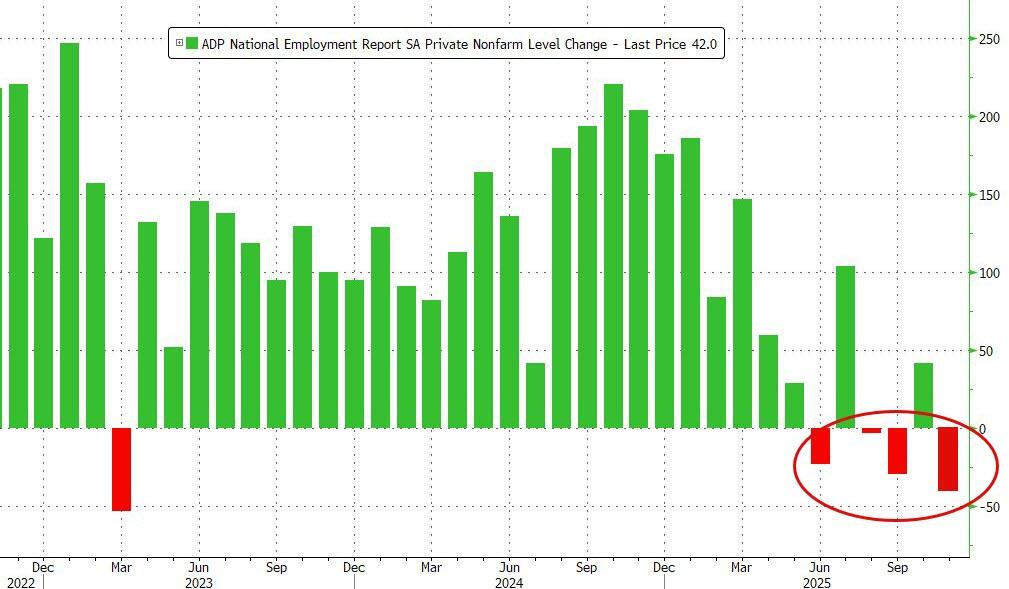
ADP’s latest report added to the cautious mood, revealing private sector job creation has slowed sharply.
On the bright side, the Senate passed a bill to end the shutdown, removing a key risk for markets and helping drive a midday turnaround in some asset classes.
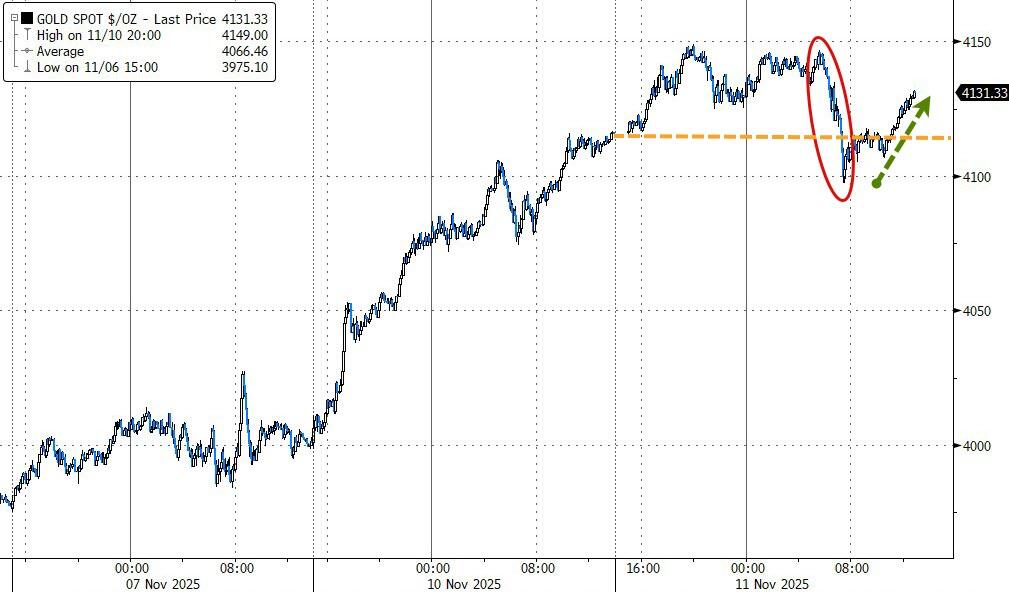
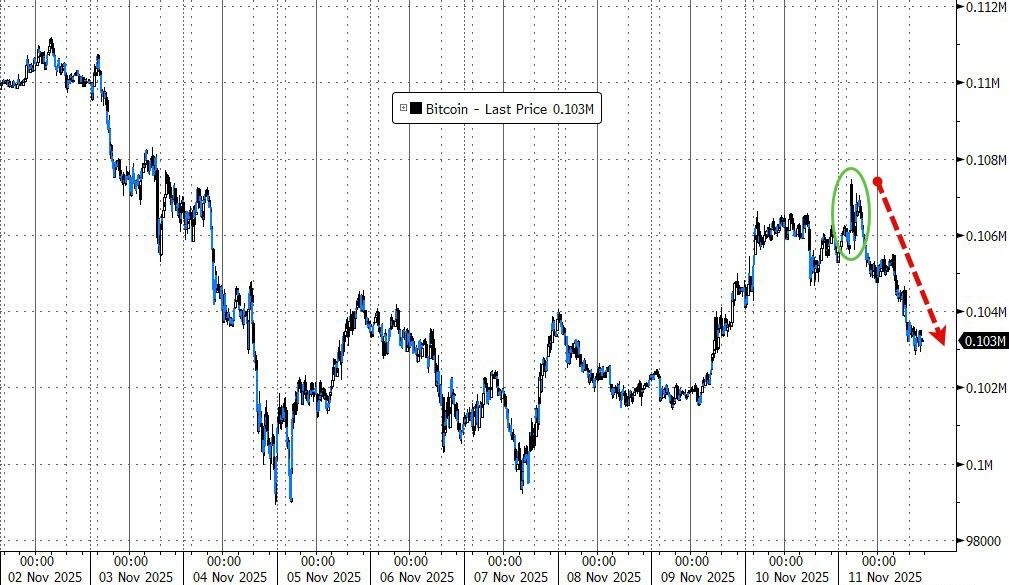
The dollar slipped on weak labor data, gold managed to stay above $4,100 after an early dip, and silver plowed higher above $51. Bitcoin spiked but gave up much of the move before the close.
Does this latest split between tech and blue chips hint at a bigger shift, or will participation broaden to lift all sectors as year-end approaches?
2. Current domestic “Buy” Cycle (effective 5/20/2025); International “Buy” Cycle (effective 5/8/25)
Our domestic bullish cycle that began on November 21, 2023, concluded on April 3, 2025, following a market downturn triggered by President Trump’s tariff policy announcement.
This development caused significant declines across major indexes and broader market indices. However, markets subsequently rebounded, culminating in a new domestic “Buy” signal taking effect May 20, 2025.
Concurrently, our International Trend Tracking Index (TTI) experienced parallel volatility. On April 4, 2025, it breached critical thresholds, prompting a “Sell” recommendation. This position reversed as global markets recovered, with the International TTI regaining sufficient momentum to issue a new “Buy” signal effective May 8, 2025.
3. Trend Tracking Indexes (TTIs)
The S&P 500 and Nasdaq started the day in the red, but the real fireworks were in the Dow, which showed plenty of muscle and led the market to a positive close.
In the end, the S&P 500 managed to inch higher while the Nasdaq couldn’t quite claw back, finishing with a moderate loss as tech stocks lagged.
Our TTIs echoed the broader market’s resilience: both notched gains, with the International TTI outshining its domestic counterpart as global stocks found some footing.
This is how we closed 11/11/2025:
Domestic TTI: +5.88% above its M/A (prior close +5.27%)—Buy signal effective 5/20/25.
International TTI: +11.17% above its M/A (prior close +10.04%)—Buy signal effective 5/8/25.
All linked charts above are courtesy of Bloomberg via ZeroHedge.
———————————————————-
WOULD YOU LIKE TO HAVE YOUR INVESTMENTS PROFESSIONALLY MANAGED?
Do you have the time to follow our investment plans yourself? If you are a busy professional who would like to have his portfolio managed using our methodology, please contact me directly to get more details.
Contact Ulli