
- Moving the market
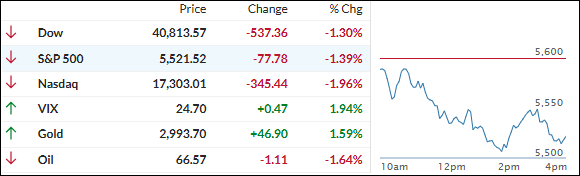
Equities began the session slightly below their respective unchanged lines but accelerated to the downside late in the day, as market volatility continued. Traders focused on the latest tariff threats, with 200% import duties on all alcoholic products from EU countries in retaliation for the bloc’s 50% tariff on whiskey.
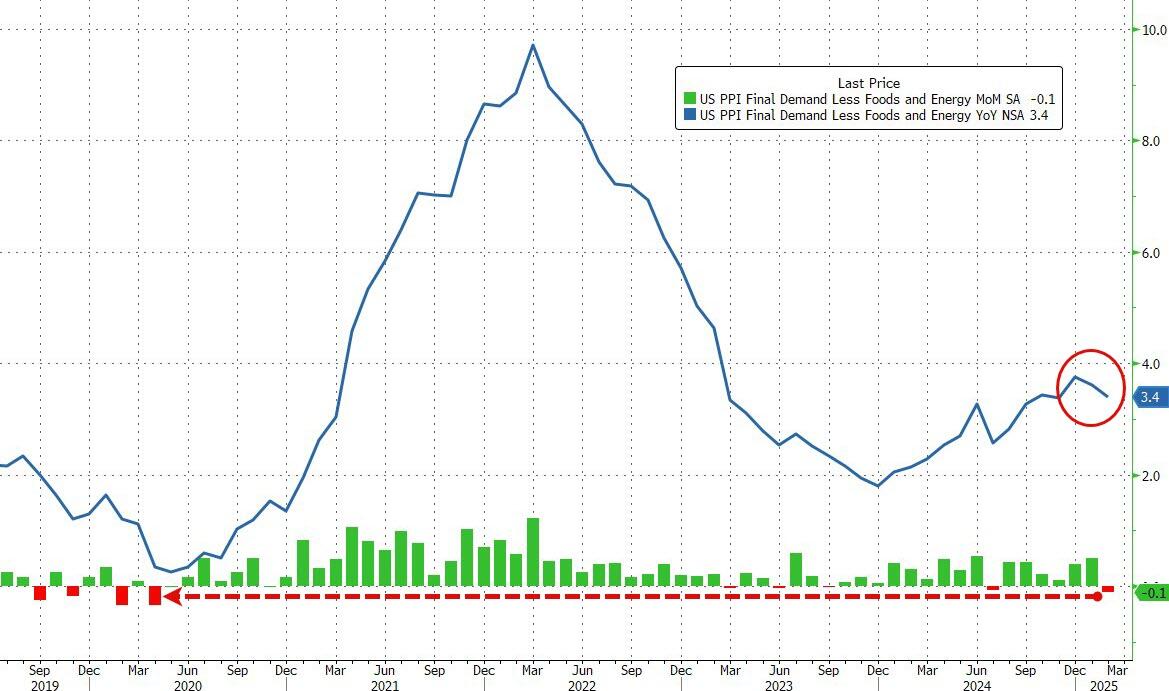
The Producer Price Index (PPI) was encouraging, showing its largest decline since April 2020, contrary to expectations of an increase. Combined with yesterday’s softer Consumer Price Index (CPI), traders’ concerns about the impact of tariffs have eased somewhat, but not enough to lift the major indexes out of their current slump.
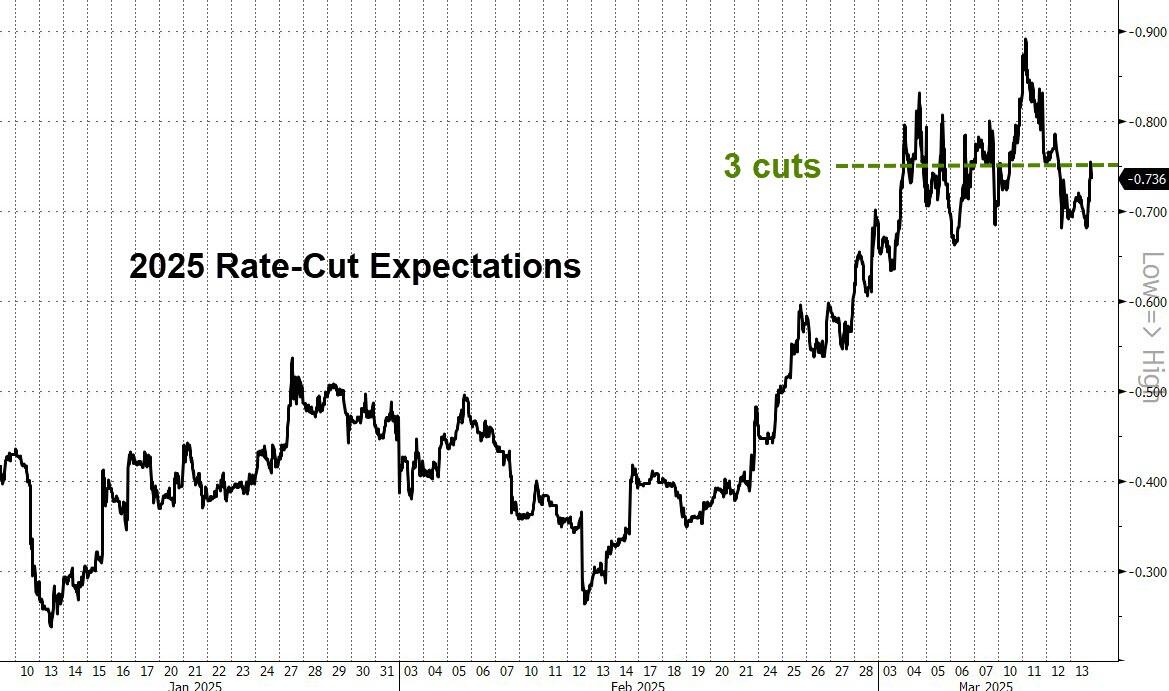
The key question remains whether current import duties will have a greater impact on economic growth or prices. Traders generally believe that weaker growth is the overriding factor, leading to the pricing in of three rate cuts for 2025.
Despite the tariff-related struggles, the decline in equities this week has been gradual rather than a crash. This suggests that any easing of trade policy could lead to a sharp rebound, which is why I have been giving the TTI a bit more room to move.
However, as of today’s close, the domestic TTI has dropped 3.34% below its long-term trend line, signaling the end of the current “Buy” cycle that began on November 21, 2023.
Effective tomorrow, our “Sell” signal for broadly diversified domestic equity funds/ETFs will be in effect. In my advisory practice, I will liquidate our remaining domestic ETFs, which were well-hedged during the recent downturn, as our exposure to gold mitigated most of the equity drop.
If there is a sharp rebound tomorrow, I will hold off for another day; otherwise, the “Sell” signal will be executed.
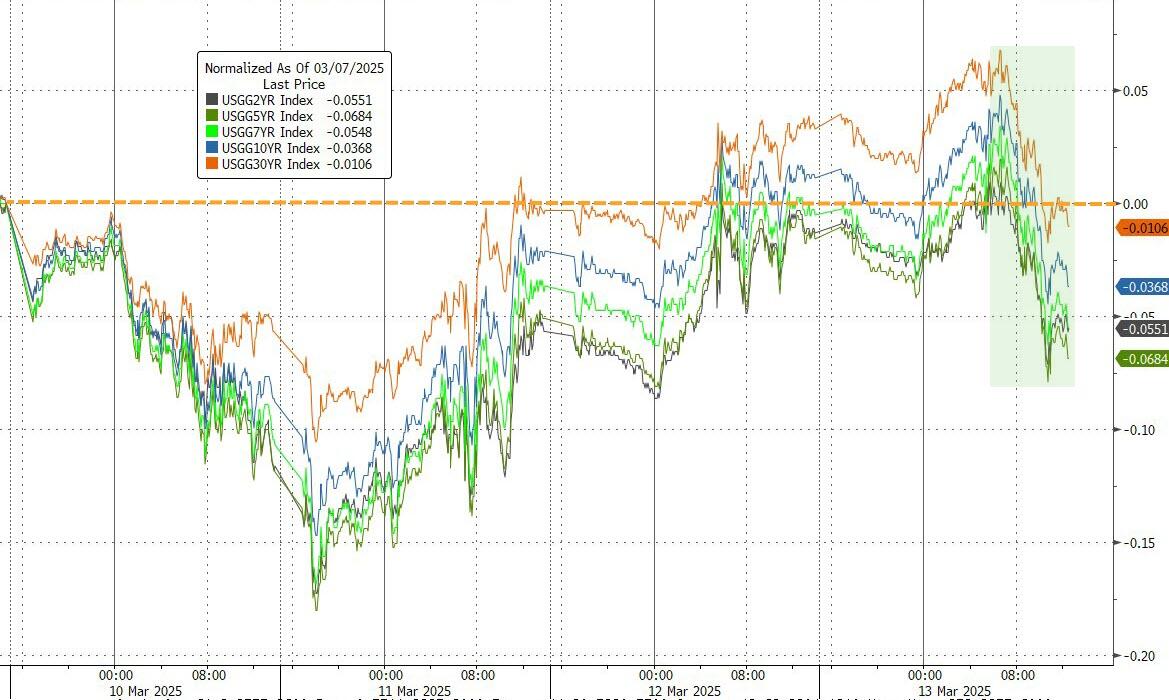
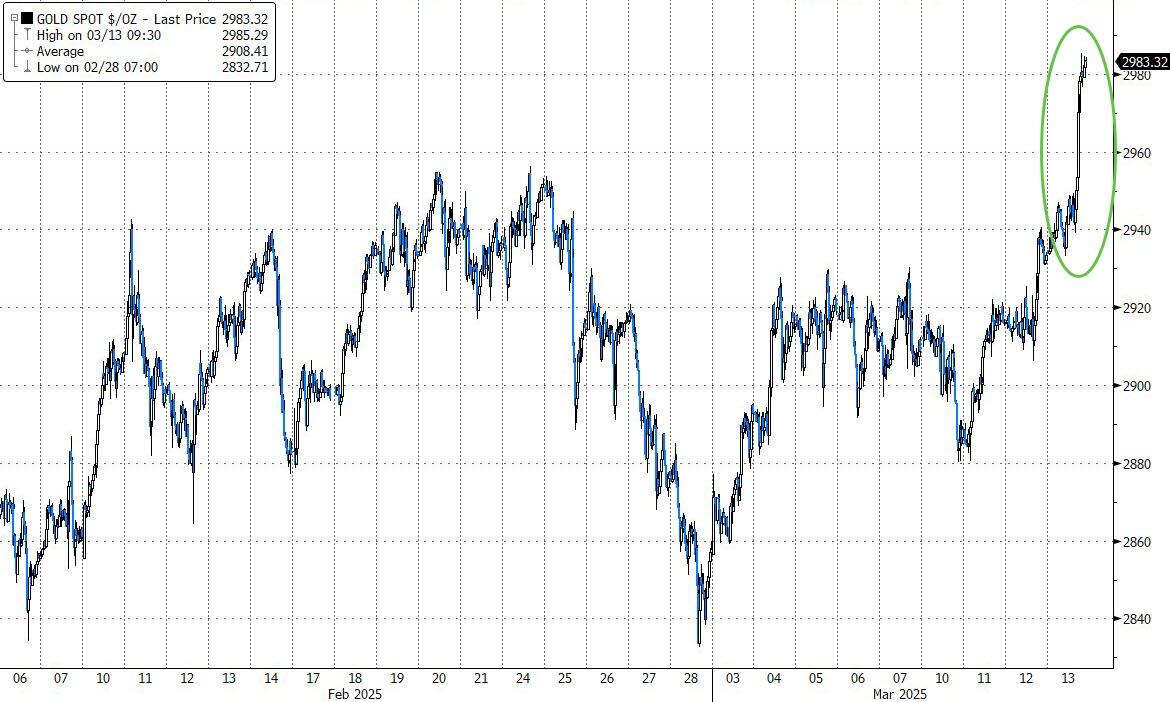
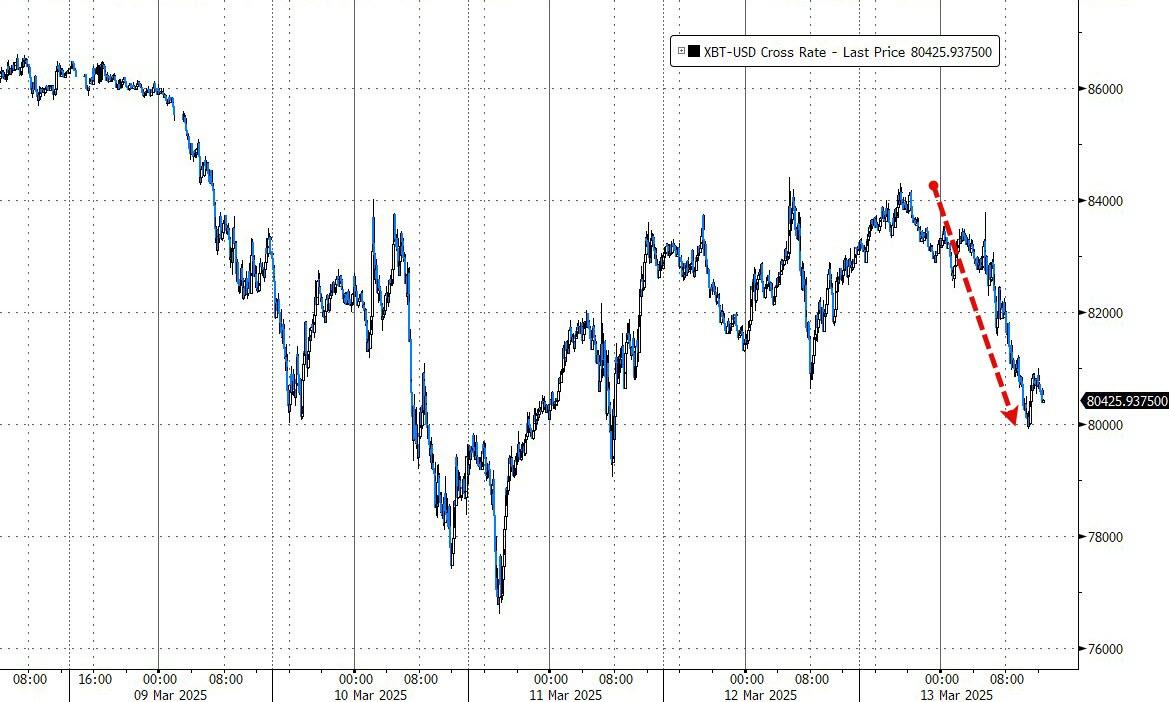
Bond yields dipped slightly, but the overall uncertainty benefited gold, pushing the precious metal close to the $3,000 mark. Bitcoin, on the other hand, fell back towards $80,000, nearing a point that could signal a bullish move.
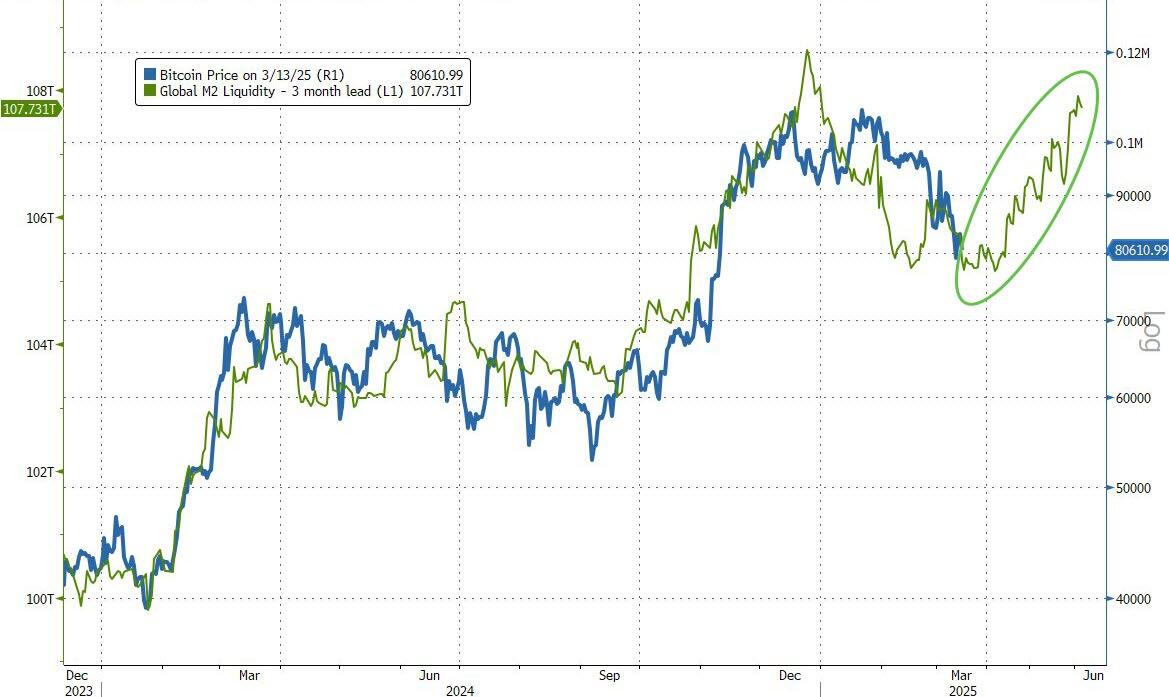
As ZH noted, global liquidity will lift many boats.
2. Current “Buy” Cycles (effective 11/21/2023)
Our Trend Tracking Indexes (TTIs) have both crossed their trend lines with enough strength to trigger new “Buy” signals. That means, Tuesday, 11/21/2023, was the official date for these signals.
If you want to follow our strategy, you should first decide how much you want to invest based on your risk tolerance (percentage of allocation). Then, you should check my Thursday StatSheet and Saturday’s “ETFs on the Cutline” report for suitable ETFs to buy.
3. Trend Tracking Indexes (TTIs)
Although the Producer Price Index exceeded expectations, it failed to stabilize equity prices. The ongoing tariff wars continued to heavily influence market direction, leading to a sharp decline in late trading.
Consequently, our domestic TTI mirrored this trend and has now generated a “Sell” signal, as highlighted in the previous market commentary.
This is how we closed 03/13/2025:
Domestic TTI: -3.34% below its M/A (prior close -2.41%)—Buy signal effective 11/21/2023.
International TTI: +3.16% above its M/A (prior close +3.84%)—Buy signal effective 11/21/2023.
All linked charts above are courtesy of Bloomberg via ZeroHedge.
———————————————————-
WOULD YOU LIKE TO HAVE YOUR INVESTMENTS PROFESSIONALLY MANAGED?
Do you have the time to follow our investment plans yourself? If you are a busy professional who would like to have his portfolio managed using our methodology, please contact me directly to get more details.
Contact Ulli