
ETF Tracker StatSheet
You can view the latest version here.
GOLD OUTPERFORMS MARKET, BITCOIN STRUGGLES BELOW $100K MARK

- Moving the market
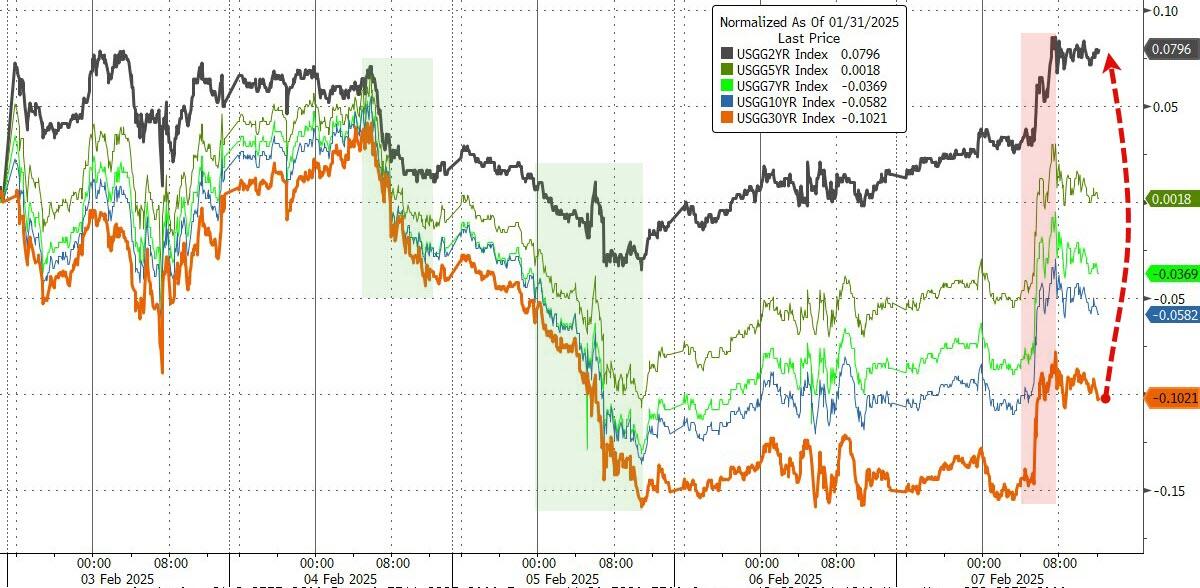
This morning, bond yields surged, with the 10-year yield spiking to 4.52%. This increase pulled the major indexes deep into the red, with the S&P 500 barely breaking even for the first week of February.
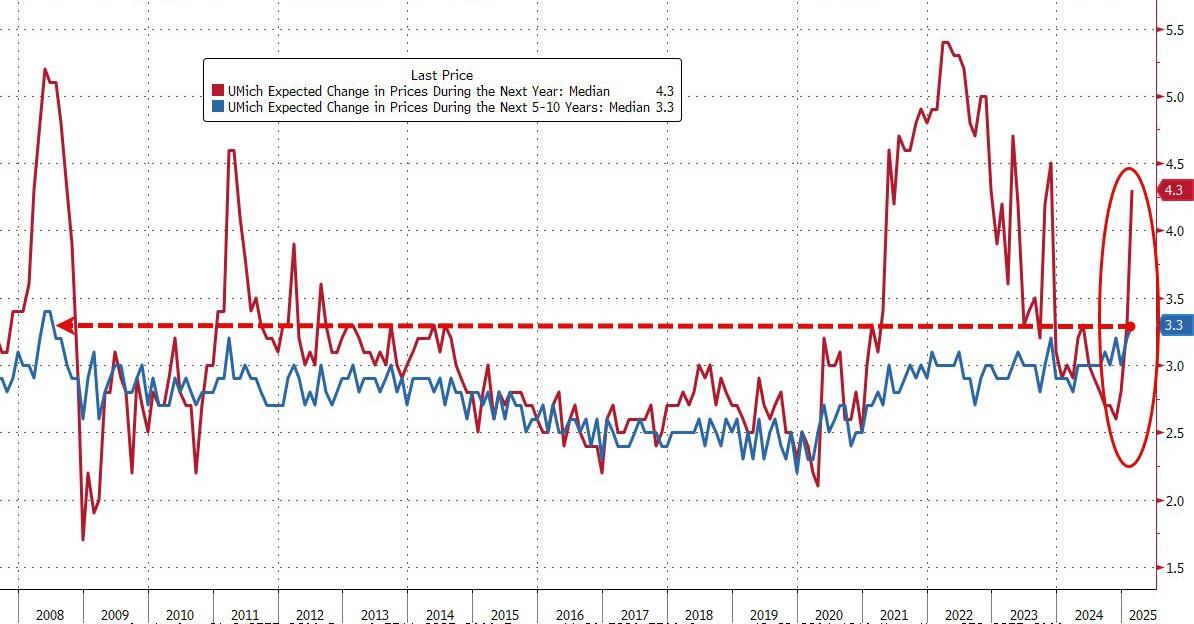
Adding to the market’s woes, consumer sentiment fell to 67.8, significantly below the expected 71.3, while inflation expectations soared in February.
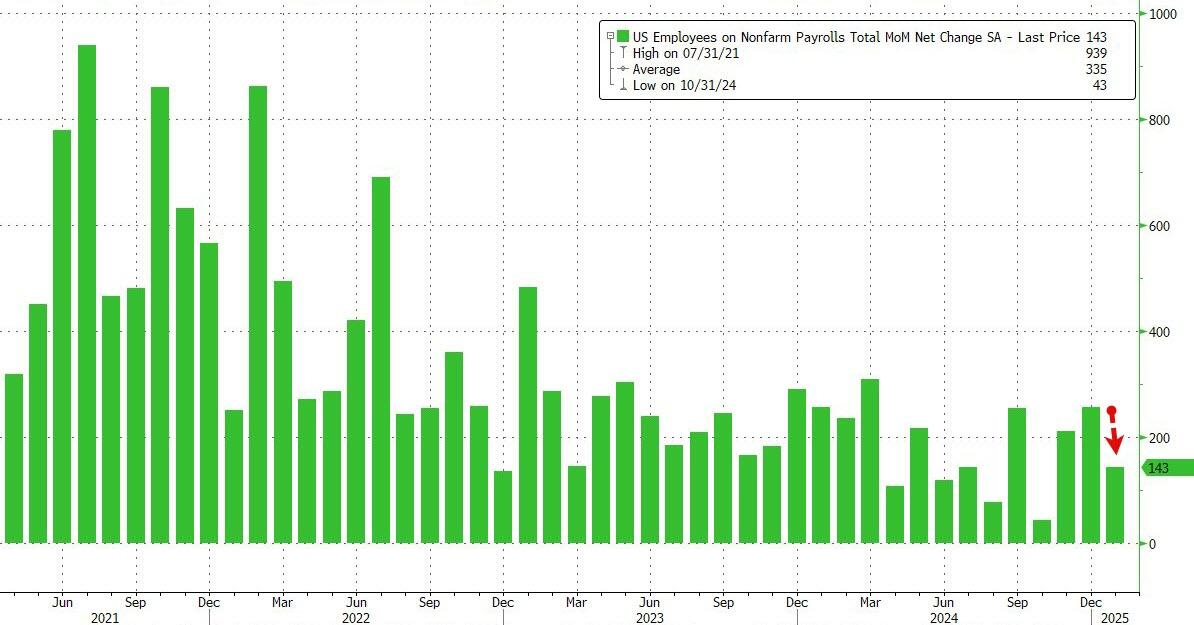
The highly anticipated jobs report revealed that only 143,000 jobs were added in January. However, traders found some positive news: the unemployment rate dropped from 4.1% to 4%, and job numbers for November and December were revised upward significantly. Additionally, average earnings for January were higher than expected, raising concerns about rising inflation.
Overall, traders interpreted the wage growth increase as a sign of a healthy labor market, which might lead the Federal Reserve to maintain its current interest rate policy, rather than lowering rates to please the markets. Despite some positive surprises, the market was primarily driven by the rebound in inflation.
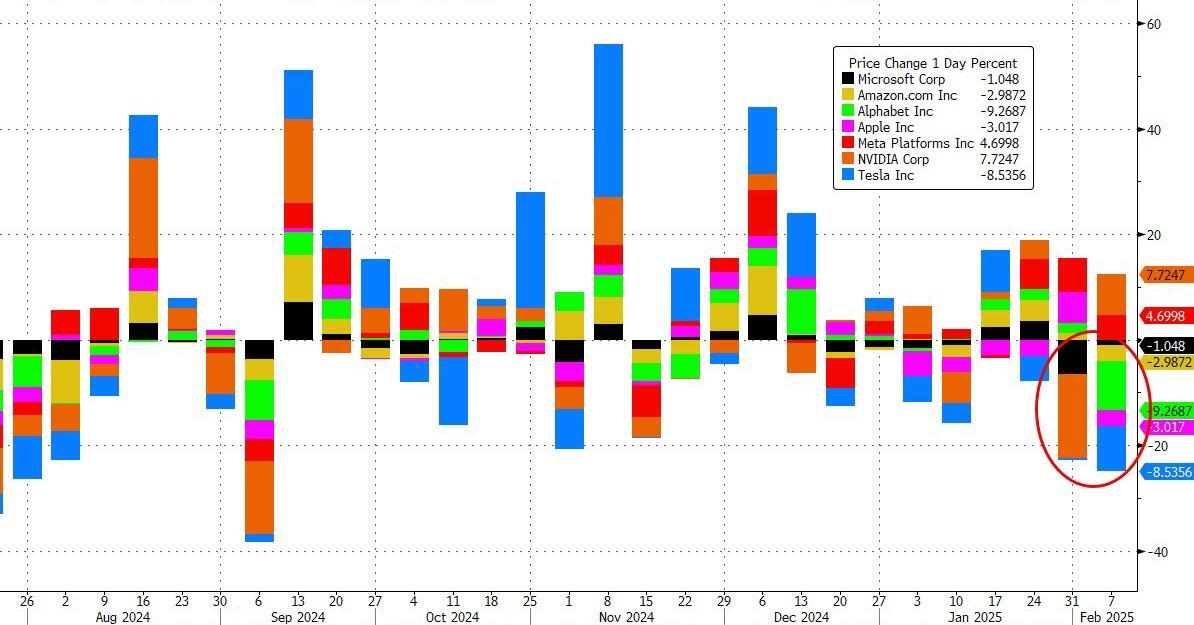
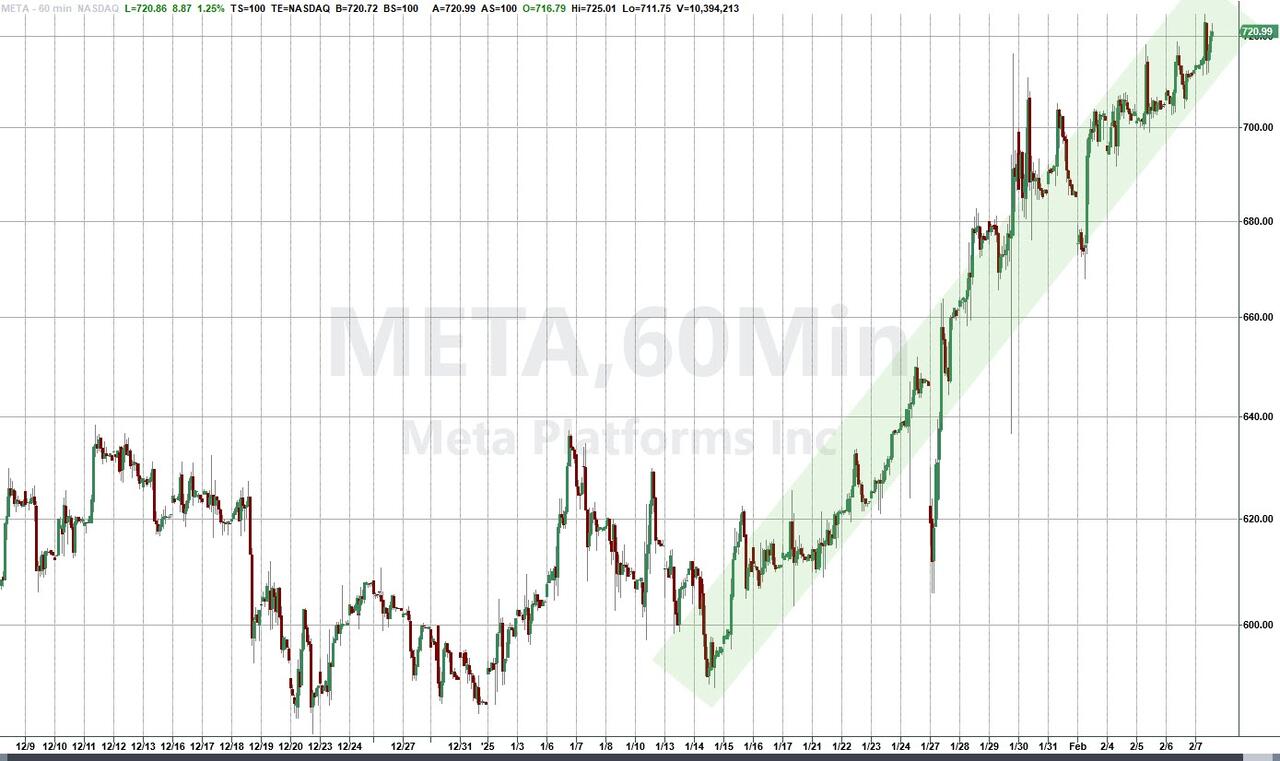
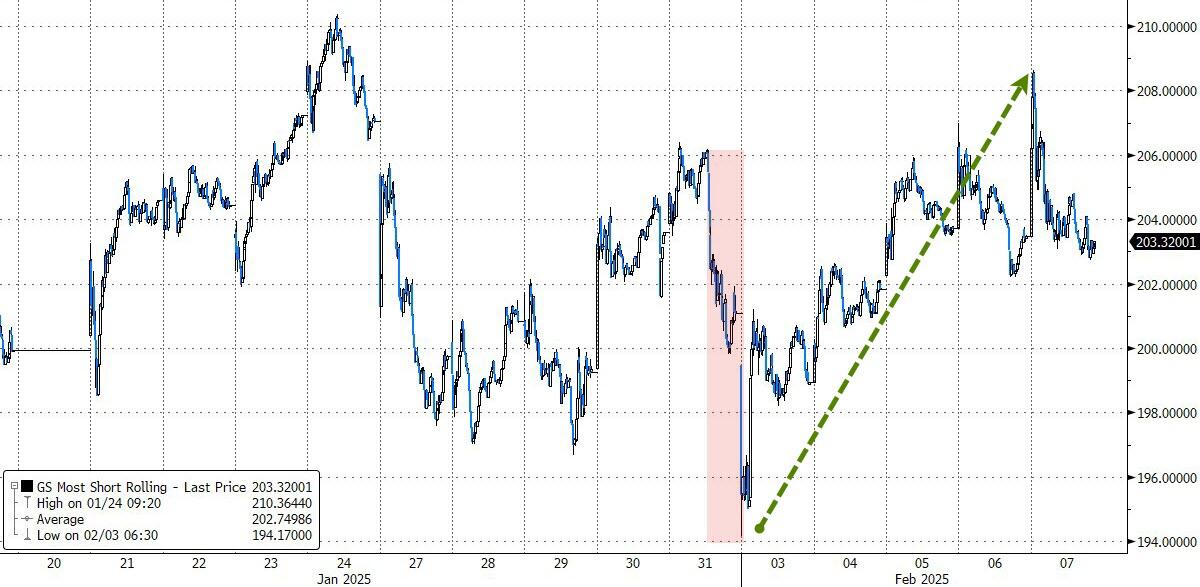
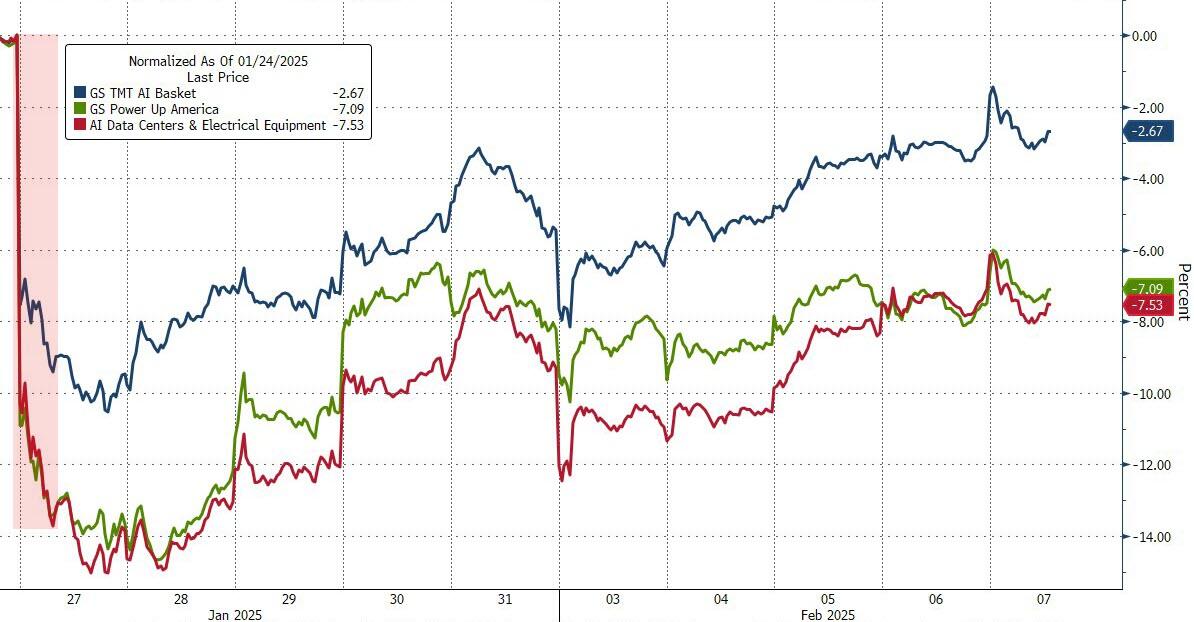
This week was crucial for Mega-Cap tech earnings, but the results were disappointing overall, causing the sector to lose approximately $625 billion. However, Meta stood out by extending its winning streak to 15 days. The short squeeze that occurred earlier in the week lost momentum today, while AI stocks began to recover from last week’s “DeepSeek” scare, which had previously tanked the sector.
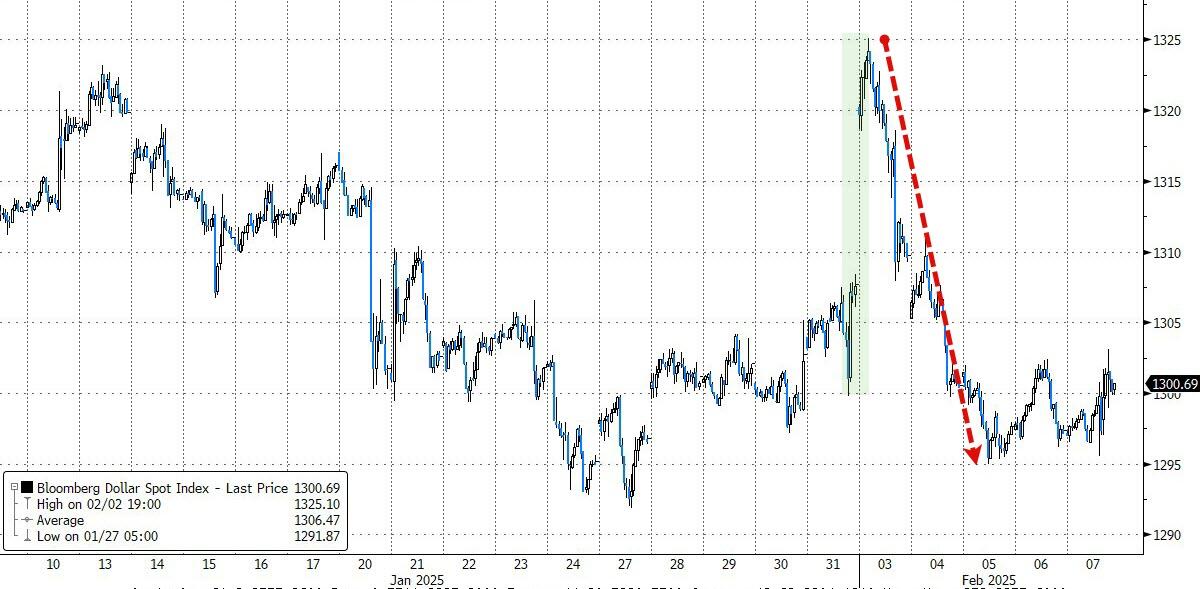
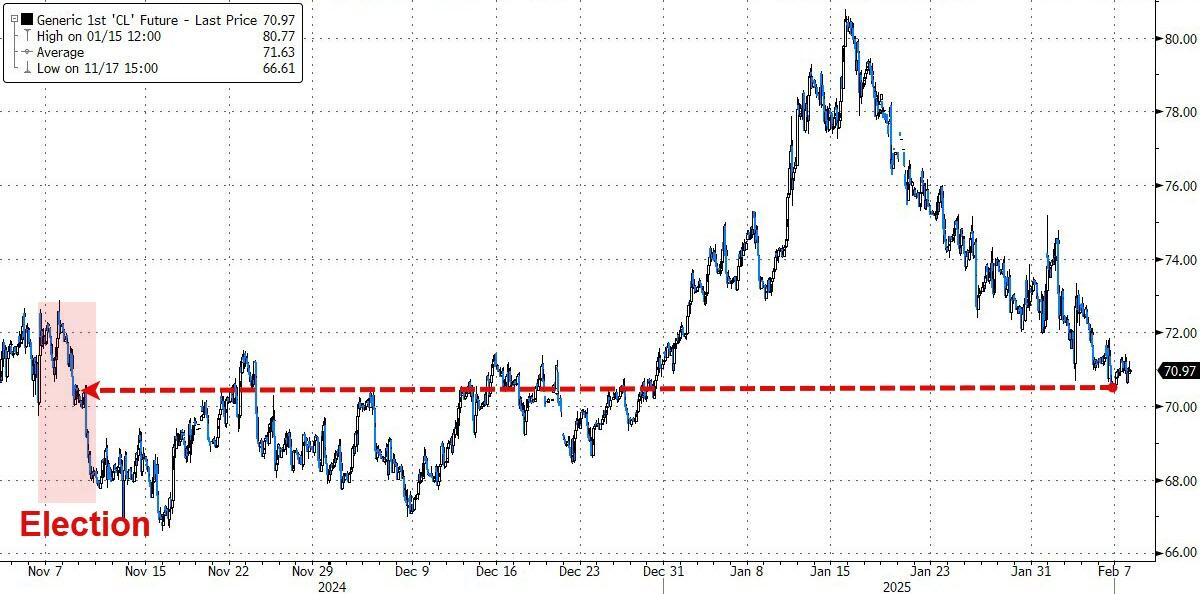
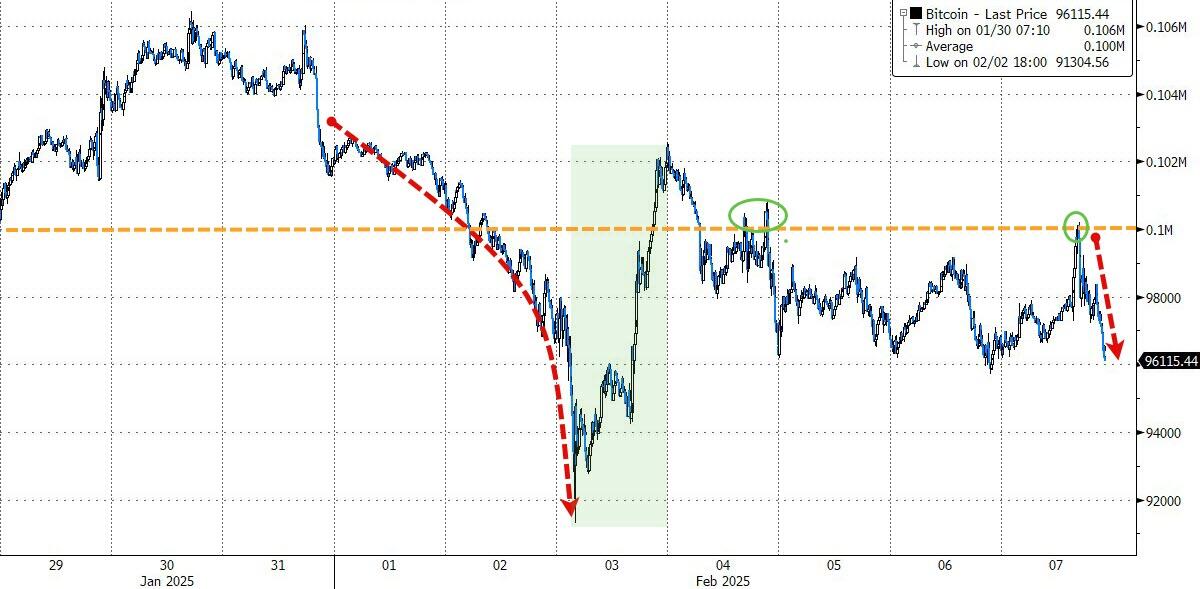
Bond yields fluctuated throughout the week, ultimately ending higher, while the dollar experienced a rollercoaster ride. Crude oil prices slipped back to pre-election lows after a recent rise. Bitcoin hovered around the $100,000 mark all week but closed below it.
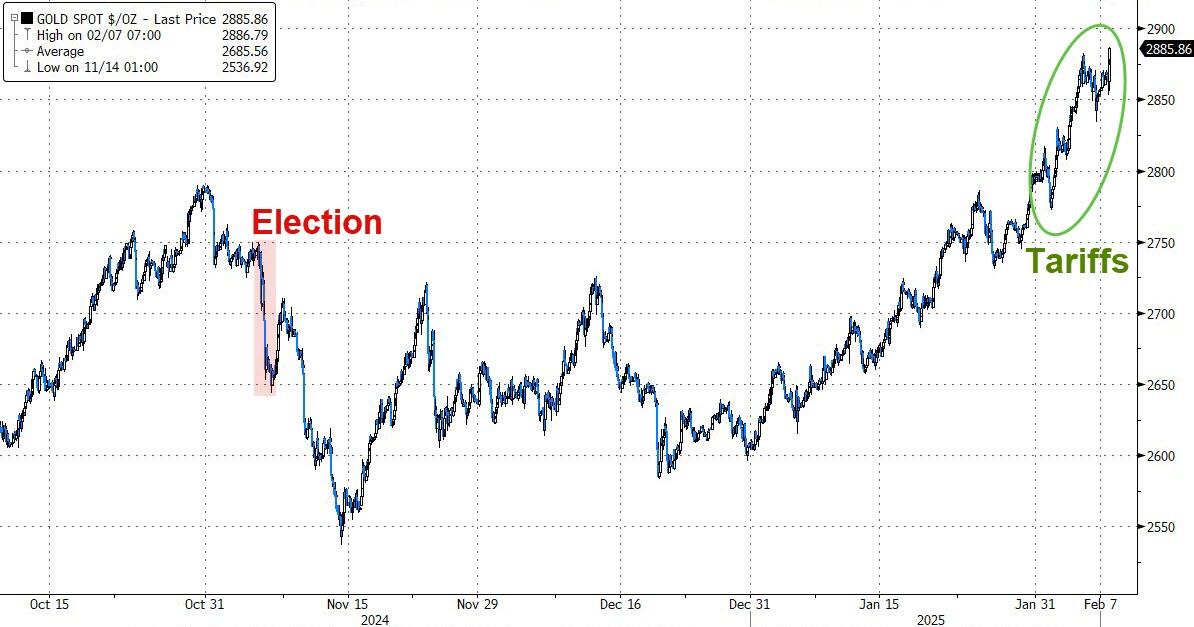
Gold was the top performer, ending the session with another record high and closing out a strong week as it approaches the $3,000 level.
Year-to-date, gold has outperformed the overall market, as measured by the S&P 500, by more than 3.5 to 1.
2. Current “Buy” Cycles (effective 11/21/2023)
Our Trend Tracking Indexes (TTIs) have both crossed their trend lines with enough strength to trigger new “Buy” signals. That means, Tuesday, 11/21/2023, was the official date for these signals.
If you want to follow our strategy, you should first decide how much you want to invest based on your risk tolerance (percentage of allocation). Then, you should check my Thursday StatSheet and Saturday’s “ETFs on the Cutline” report for suitable ETFs to buy.
3. Trend Tracking Indexes (TTIs)
The stock market began the day on a positive note, with major indexes showing initial gains.
However, this upward momentum was short-lived. As the day progressed, the indexes reversed course and ended in negative territory due rising inflation expectations, increasing bond yields, and unexpected negative macroeconomic data.
These elements combined to give the bears the advantage.
Similarly, our TTIs mirrored this trend, relinquishing some of their earlier gains.
This is how we closed 02/07/2025:
Domestic TTI: +3.74% above its M/A (prior close +4.49%)—Buy signal effective 11/21/2023.
International TTI: +4.98% above its M/A (prior close +5.82%)—Buy signal effective 11/21/2023.
All linked charts above are courtesy of Bloomberg via ZeroHedge.
———————————————————-
WOULD YOU LIKE TO HAVE YOUR INVESTMENTS PROFESSIONALLY MANAGED?
Do you have the time to follow our investment plans yourself? If you are a busy professional who would like to have his portfolio managed using our methodology, please contact me directly to get more details.
Contact Ulli