
ETF Tracker StatSheet
You can view the latest version here.
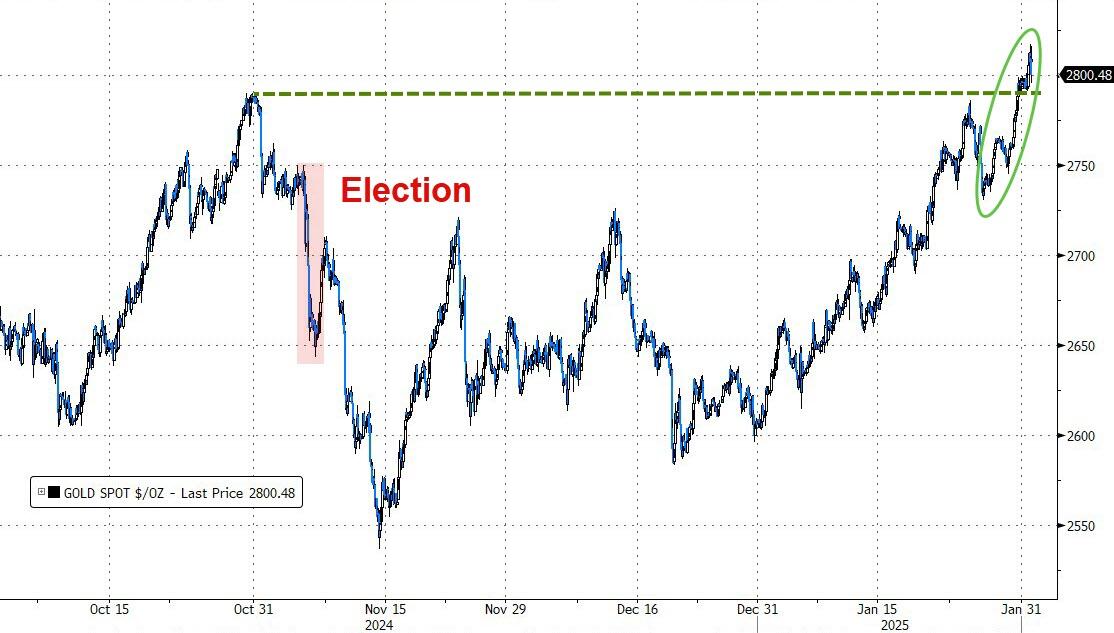
GOLD HITS RECORD HIGHS AS MARKETS REACT TO TARIFFS AND INFLATION

- Moving the market
Despite Apple releasing a mixed earnings report, bullish sentiment persisted through mid-session on the last trading day of the month.
However, investor confidence waned later in the day as bond yields spiked and President Trump’s tariffs on Canadian and Mexican goods were set to take effect the next day. This shift in sentiment caused the major indices to end the day in the red.
Apple exceeded first-quarter expectations but reported disappointing iPhone sales. Despite this, traders focused on the positive aspects, and the stock gained 1.6%. In contrast, Chevron and Exxon reported fourth-quarter results below expectations, leading to declines of 4.5% and 2.5%, respectively.
A key data point, the Personal Consumption Expenditure (PCE) price index, which is the Federal Reserve’s preferred inflation gauge, showed a 0.3% increase from November and a 2.6% annual rate. While this was in line with expectations, it highlighted the ongoing rise in inflation, accelerating from the previous month’s rate of 2.4%. Could this be why gold is reaching new all-time highs?
Despite a rocky month, the major indices managed to recover from various selloffs and posted solid gains. The Dow led with a 4.7% increase, followed by the S&P 500 at 2.7%, and the Nasdaq at 1.5%.
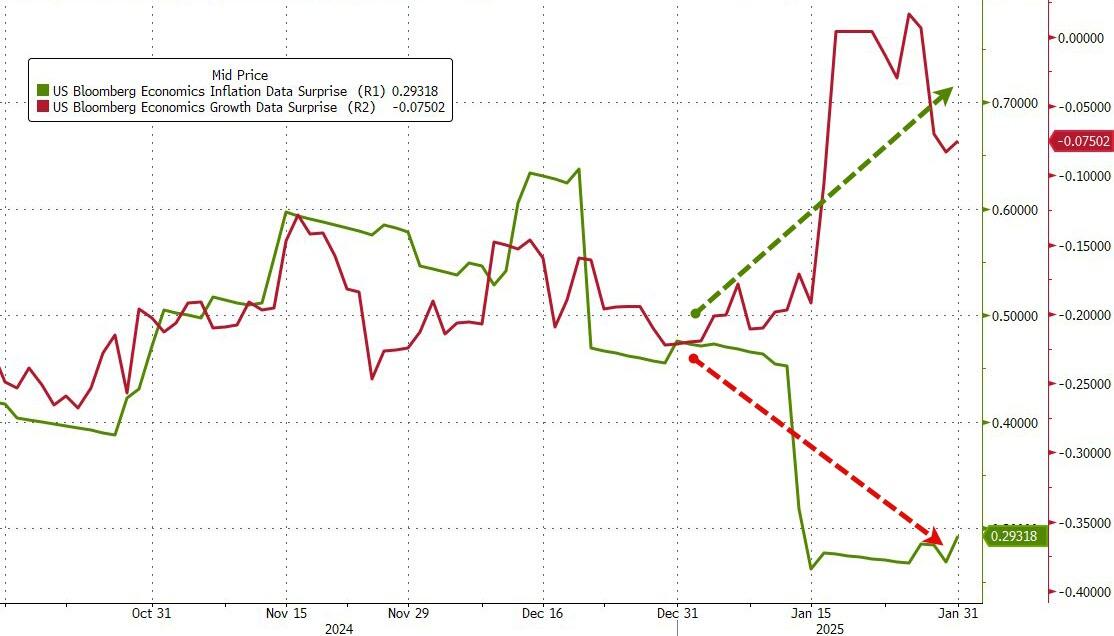
Traders viewed this month as a “goldilocks” period, with growth data exceeding expectations and inflation data being less severe than anticipated, reinforcing the belief that the economy is growing while inflation is slowing.
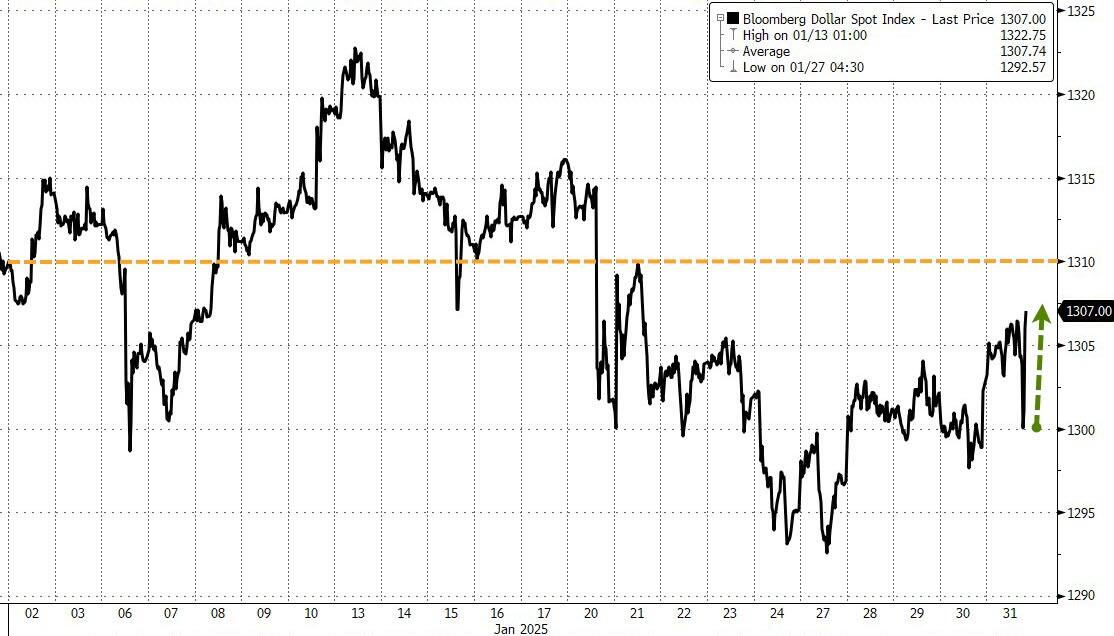
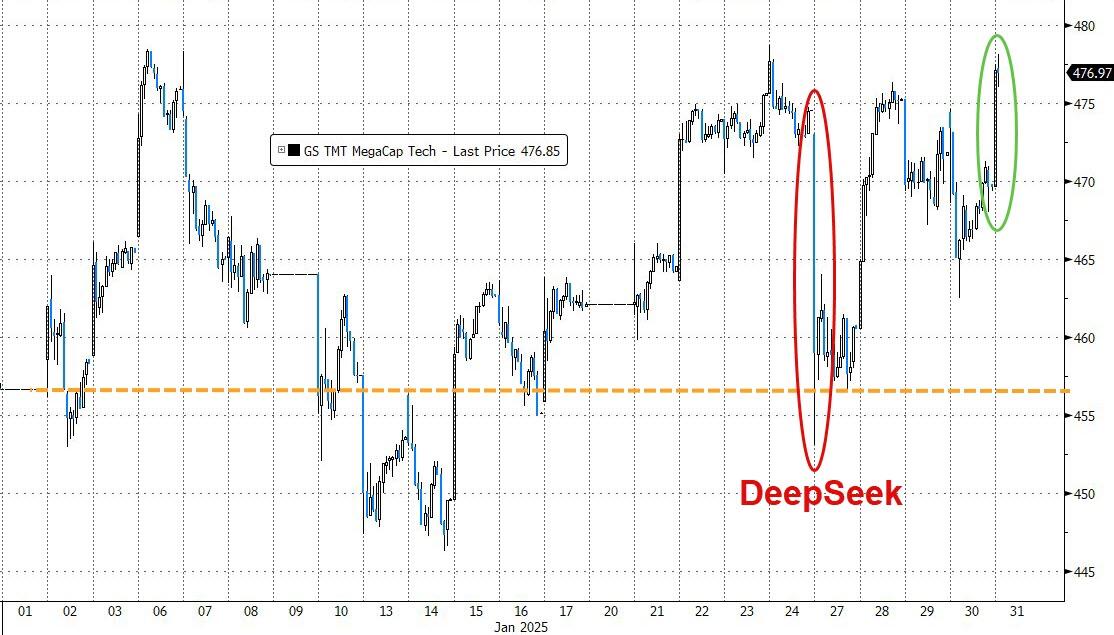
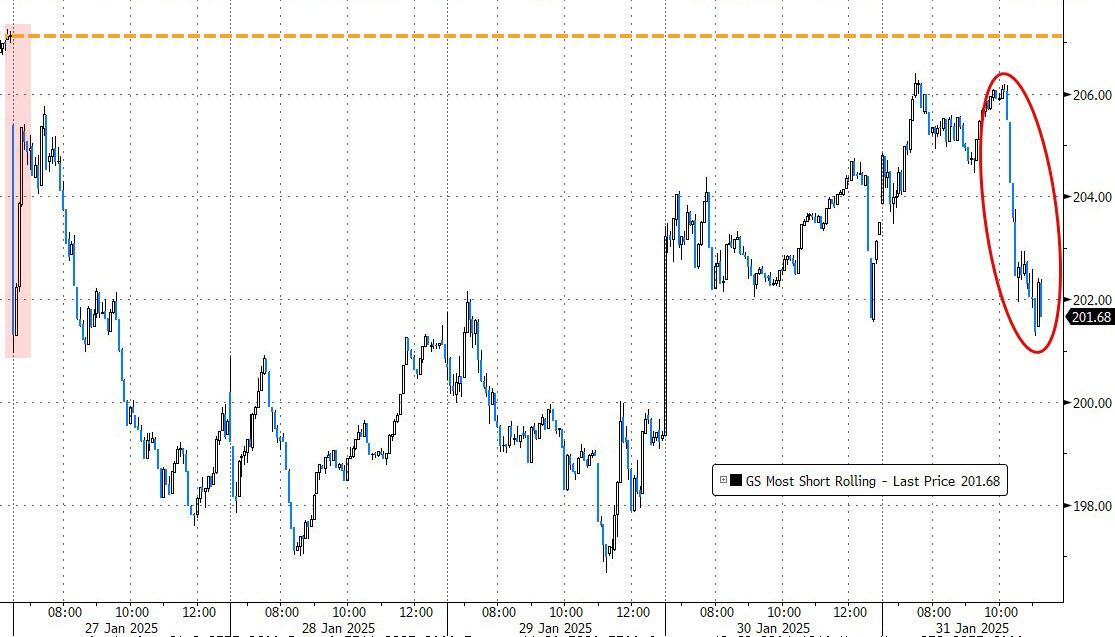
The US dollar ended the month lower despite today’s spike. Mega-cap tech stocks recovered from the “DeepSeek” scare, while the most shorted stocks were hit hard due to Trump’s tariff announcement.
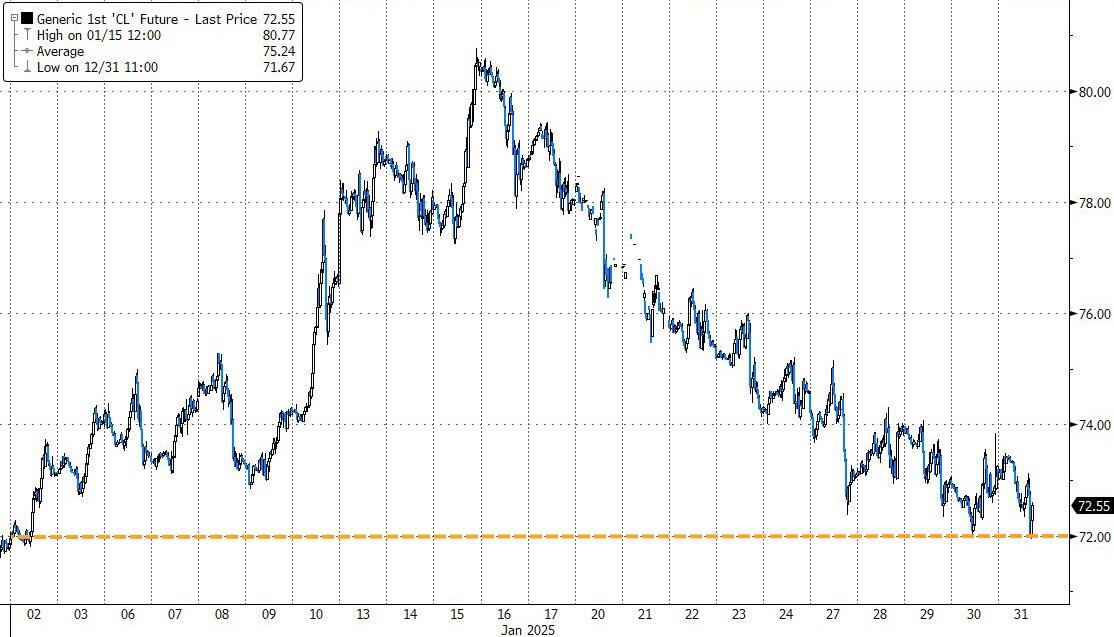
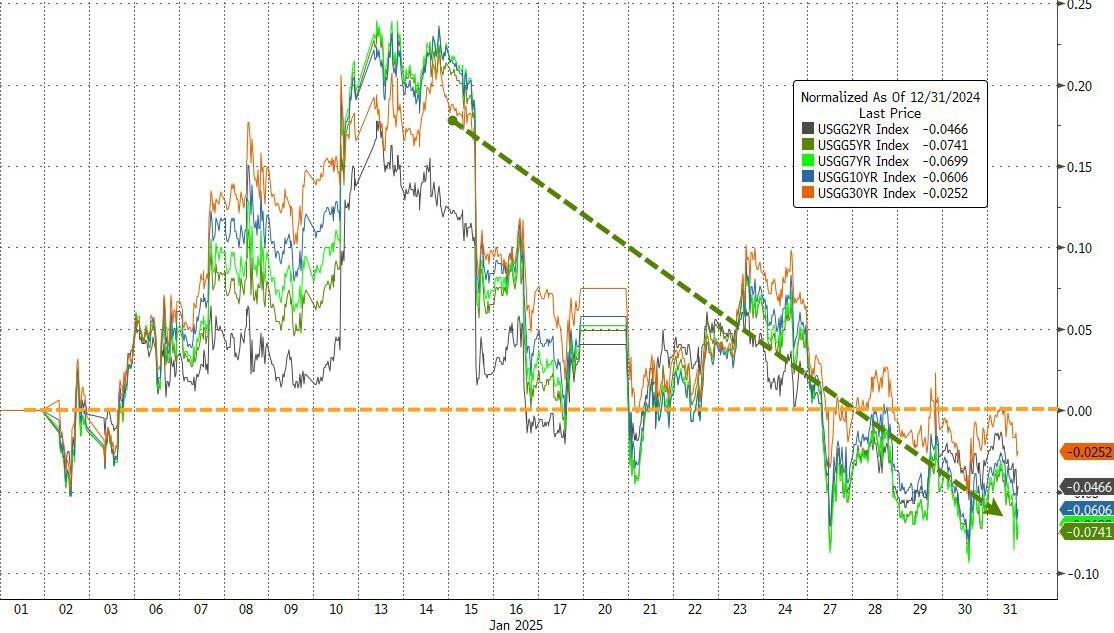
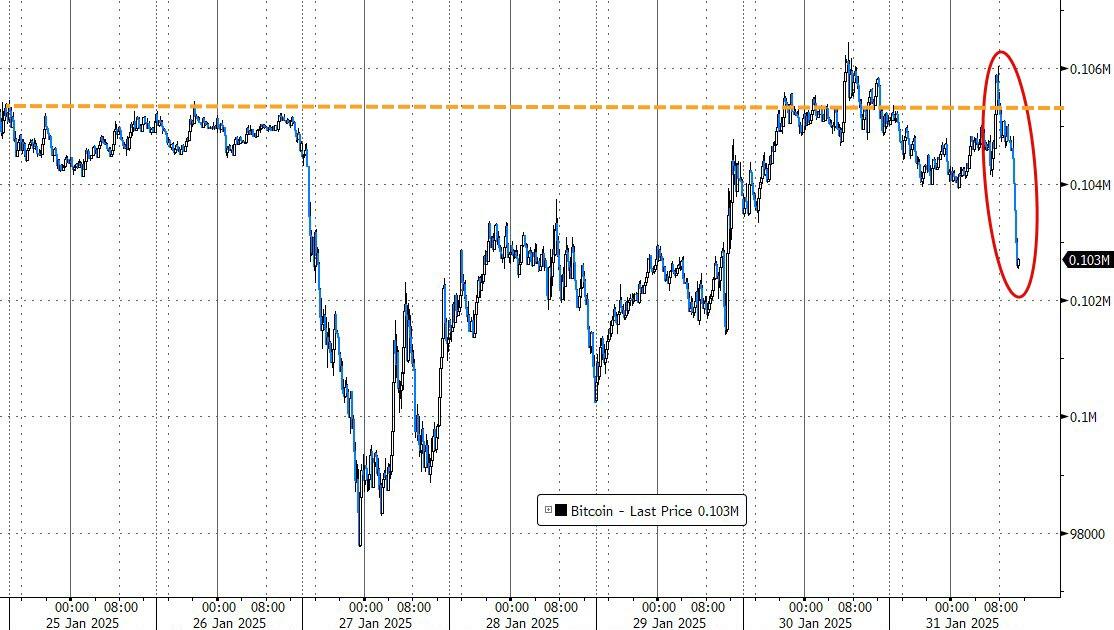
Oil prices remained unchanged for January, but gold rallied over 7%, marking its best start to a year since 2015 and reaching a record high of $2,800. Bond yields saw volatility, initially spiking before selling off and ending the month lower. Bitcoin also had a strong month, advancing nearly 9% and emerging as the top performer.
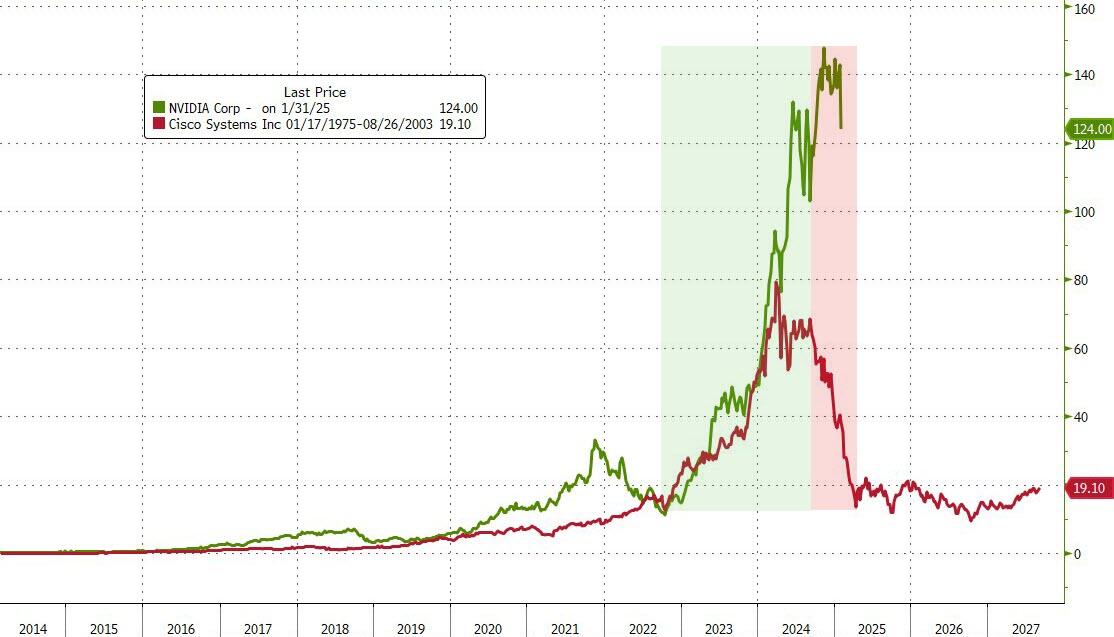
With Nvidia experiencing its biggest weekly loss of $450 billion since September 2022, ZeroHedge pointed to a historical analog, prompting the question:
Will history repeat itself?
2. Current “Buy” Cycles (effective 11/21/2023)
Our Trend Tracking Indexes (TTIs) have both crossed their trend lines with enough strength to trigger new “Buy” signals. That means, Tuesday, 11/21/2023, was the official date for these signals.
If you want to follow our strategy, you should first decide how much you want to invest based on your risk tolerance (percentage of allocation). Then, you should check my Thursday StatSheet and Saturday’s “ETFs on the Cutline” report for suitable ETFs to buy.
3. Trend Tracking Indexes (TTIs)
On the final trading day of the month, the market initially showed promise with a positive start. However, this optimism was short-lived, as the major indices reversed direction and ended January on a weak note.
The shift in sentiment was largely influenced by President Trump’s announcement of impending tariffs on Canadian and Mexican goods, set to take effect the following day. This news triggered a spike in bond yields, a rally in the dollar, and a decline in equities.
Our TTIs were not immune to these market dynamics, as both experienced a pullback, surrendering some of their recent gains.
This is how we closed 01/31/2025:
Domestic TTI: +4.57% above its M/A (prior close +5.75%)—Buy signal effective 11/21/2023.
International TTI: +4.77% above its M/A (prior close +5.53%)—Buy signal effective 11/21/2023.
All linked charts above are courtesy of Bloomberg via ZeroHedge.
———————————————————-
WOULD YOU LIKE TO HAVE YOUR INVESTMENTS PROFESSIONALLY MANAGED?
Do you have the time to follow our investment plans yourself? If you are a busy professional who would like to have his portfolio managed using our methodology, please contact me directly to get more details.
Contact Ulli