ETF Tracker StatSheet
You can view the latest version here.
EQUITIES FALL AS STRONG JOBS REPORT DIMS RATE CUT HOPES

- Moving the market
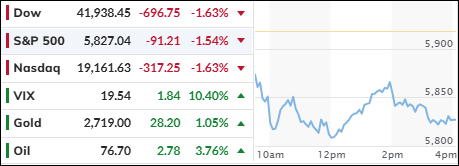
This morning, equities took a hit as the latest economic reports dampened traders’ expectations for further rate cuts in 2025. The jobs report revealed that U.S. payrolls grew by 256,000 in December, significantly surpassing the expected 155,000. Additionally, the unemployment rate fell to 4.1%, contrary to projections that it would remain steady at 4.2%.
Throughout 2024, we saw similar scenarios where initial gains were later revised down, resulting in disappointment. While I anticipate a similar outcome this time, the current data is undeniably market moving.
Consequently, bond yields spiked to their highest levels since late 2023, with the 10-year yield ending at 4.77%. The probability that the Federal Reserve will hold rates steady at their upcoming meeting is now at 97%. As usual, good economic news translates to bad news for the markets.
Despite the current rebound in macro data and rising inflation fears, traders believe that the labor market will weaken in the coming quarters, potentially forcing the Fed to soften its policy with further rate cuts.
The major indexes lost about 2% for the week, with Small Caps, which are most sensitive to interest rates, faring the worst. Leading the decline was the China Index, which has now tumbled over 20% from its recent high, entering bear market territory.
The dollar continued its gains, and despite its strength, gold surged and crossed the $2,700 level again. Bitcoin experienced a volatile week, storming higher overnight but ending lower after crossing $100,000 last Monday.
Crude oil had a strong week in terms of price, aided by additional Russian sanctions and colder temperatures. However, higher pump prices are likely to follow, further increasing inflation expectations.
Given all these developments, I ponder: Why has the Fed been lowering rates? Ah yes because inflation is supposedly transitory…
2. Current “Buy” Cycles (effective 11/21/2023)
Our Trend Tracking Indexes (TTIs) have both crossed their trend lines with enough strength to trigger new “Buy” signals. That means, Tuesday, 11/21/2023, was the official date for these signals.
If you want to follow our strategy, you should first decide how much you want to invest based on your risk tolerance (percentage of allocation). Then, you should check my Thursday StatSheet and Saturday’s “ETFs on the Cutline” report for suitable ETFs to buy.
3. Trend Tracking Indexes (TTIs)
Today, the stock market lacked bullish sentiment, as positive economic data unexpectedly had a negative impact on equity markets. This reaction was due to concerns about future interest rate decisions, which are crucial for market performance.
Traders interpreted the better-than-expected jobs report and lower unemployment rate as potential obstacles to the anticipated Federal Reserve rate cut later this month, leading to a market decline.
Our TTIs performed slightly better than the S&P 500. The Domestic TTI managed to stay above its trend line, which distinguishes bullish from bearish territory.
However, the International TTI fell below its trend line by -0.5%. Given that this is its first and minor drop below the line, I will wait to see if it remains below this level before issuing a “Sell” signal for the international sector.
This is how we closed 01/10/2025:
Domestic TTI: +0.91% above its M/A (prior close +2.61%)—Buy signal effective 11/21/2023.
International TTI: -0.50% below its M/A (prior close +1.05%)—Buy signal effective 11/21/2023.
All linked charts above are courtesy of Bloomberg via ZeroHedge.
———————————————————-
WOULD YOU LIKE TO HAVE YOUR INVESTMENTS PROFESSIONALLY MANAGED?
Do you have the time to follow our investment plans yourself? If you are a busy professional who would like to have his portfolio managed using our methodology, please contact me directly to get more details.
Contact Ulli