

- Moving the market
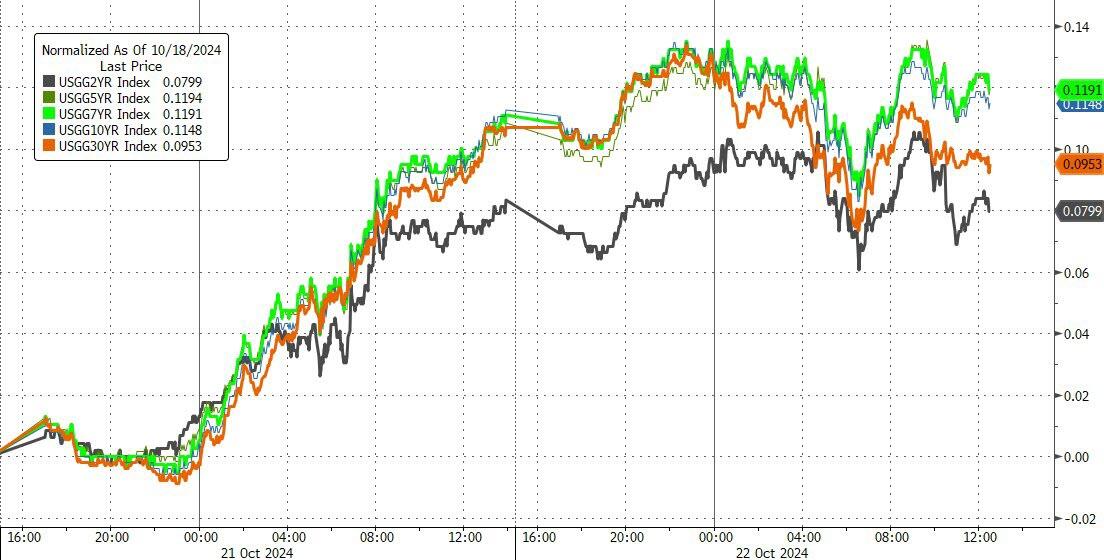
This morning, rising bond yields were at the forefront of traders’ minds, dampening the positive sentiment that had characterized the start of the earnings season.
The 10-year Treasury yield briefly climbed above 4.22%, a level not seen in three months. Although it retreated as the session progressed, the major indexes slipped and struggled to deal with this overhead resistance.
The surge in yields was partly driven by comments from the Fed’s Kashkari, who suggested that the Central Bank might adopt a more “modest” approach moving forward. Traders were puzzled by the surge in yields following the Fed’s 0.5% rate cut a month ago, as this was the opposite of what they had anticipated.
An improving economy contributed to the rise in yields, but there was also pessimism that the Fed might not be as aggressive with future rate cuts. Despite this, traders currently see an 89% chance of the Fed cutting rates by another 0.25% at their next meeting on November 7.
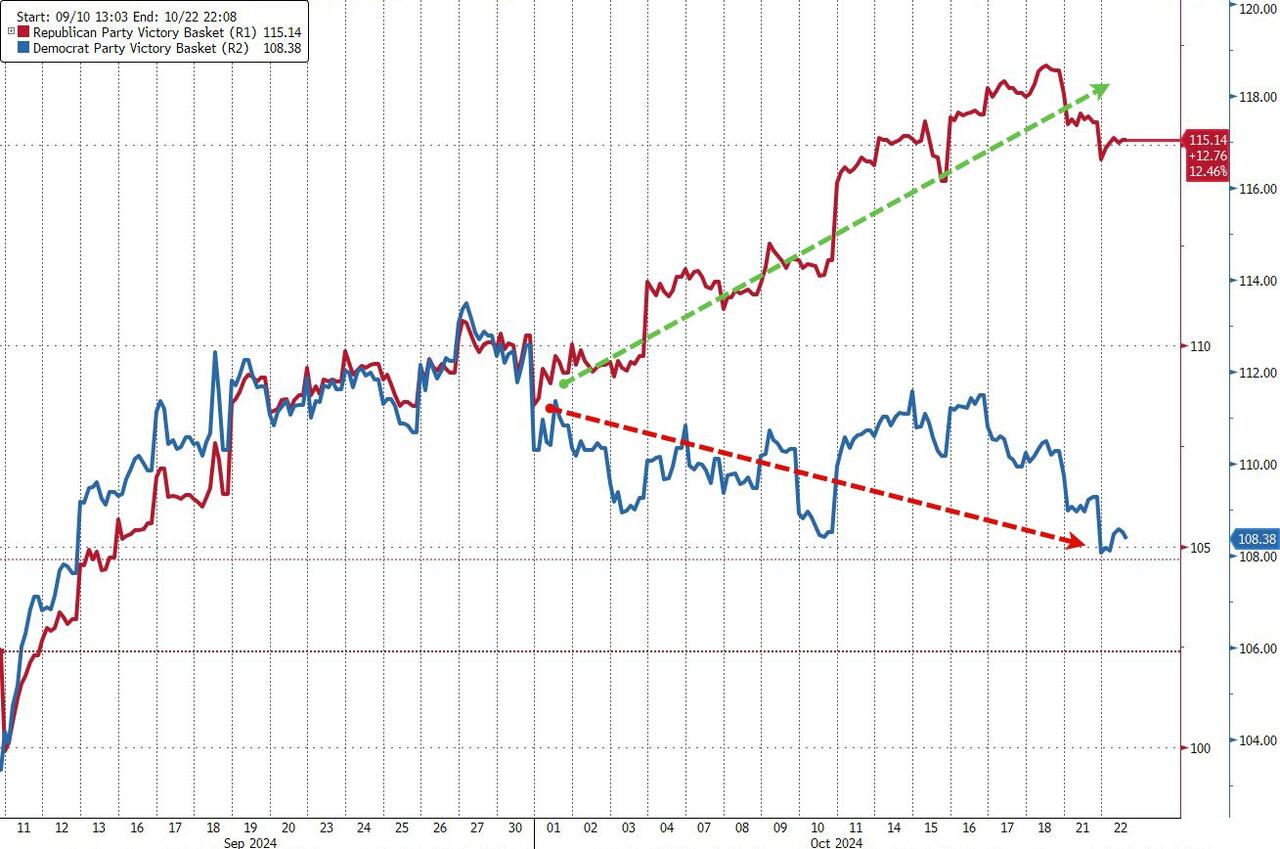
Ultimately, the markets fluctuated without clear direction, with the major indexes closing roughly unchanged. Traders’ attention was also focused on the upcoming election, with current bets indicating a one-sided outcome. However, as the saying goes, it’s never over till it’s over.
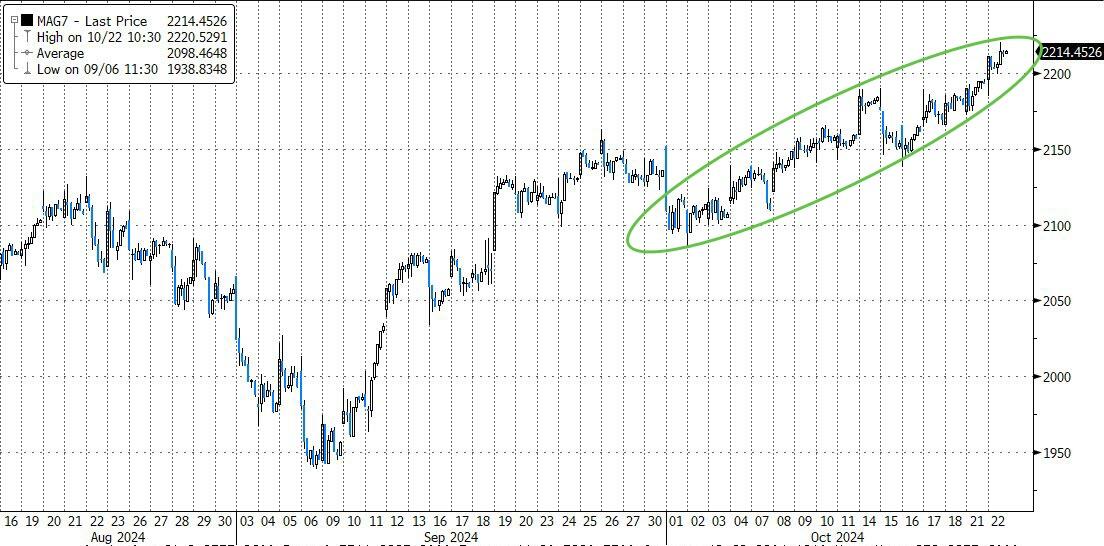
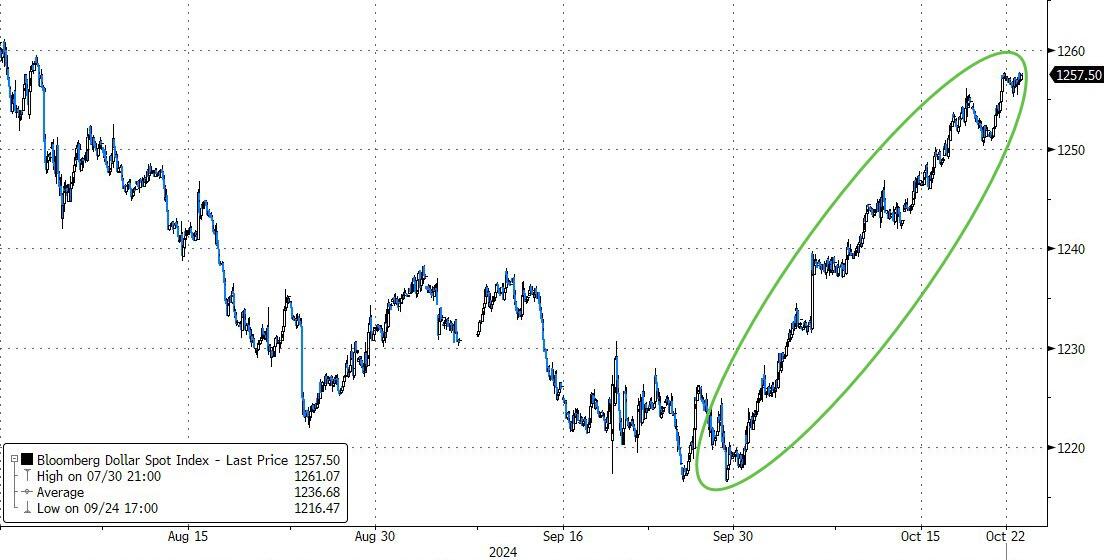
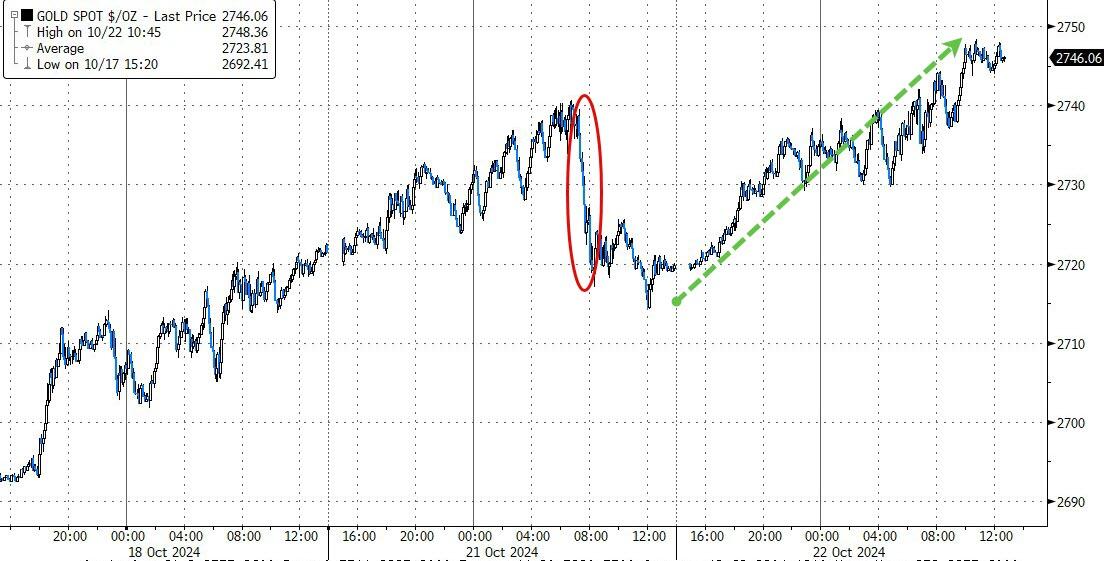
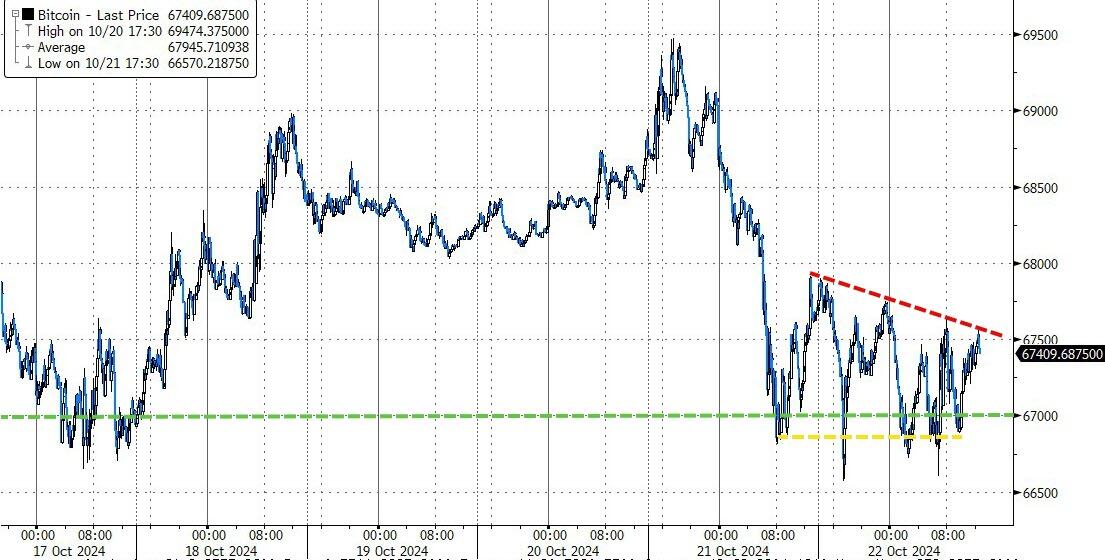
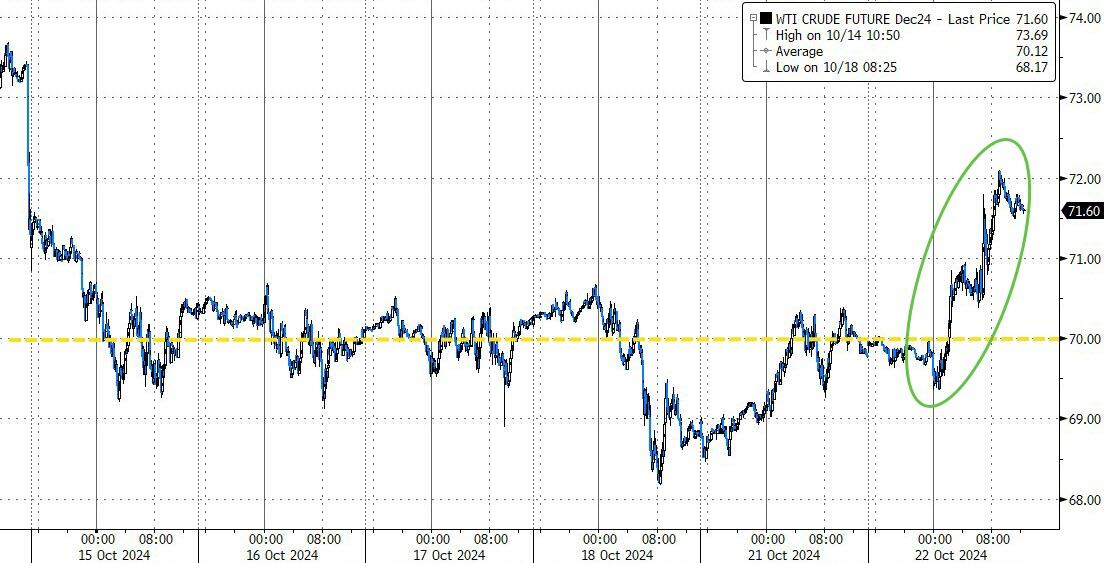
The MAG7 basket managed to eke out a gain, aided by bond yields flattening out towards the close. The dollar advanced moderately, while gold surged to set another record, with its GLD ETF rising by a solid 1.06% to close above $2,760. Silver also saw gains, but Bitcoin remained stagnant, finding support at the $67,000 level. Crude oil rallied, surpassing the $77 price point.
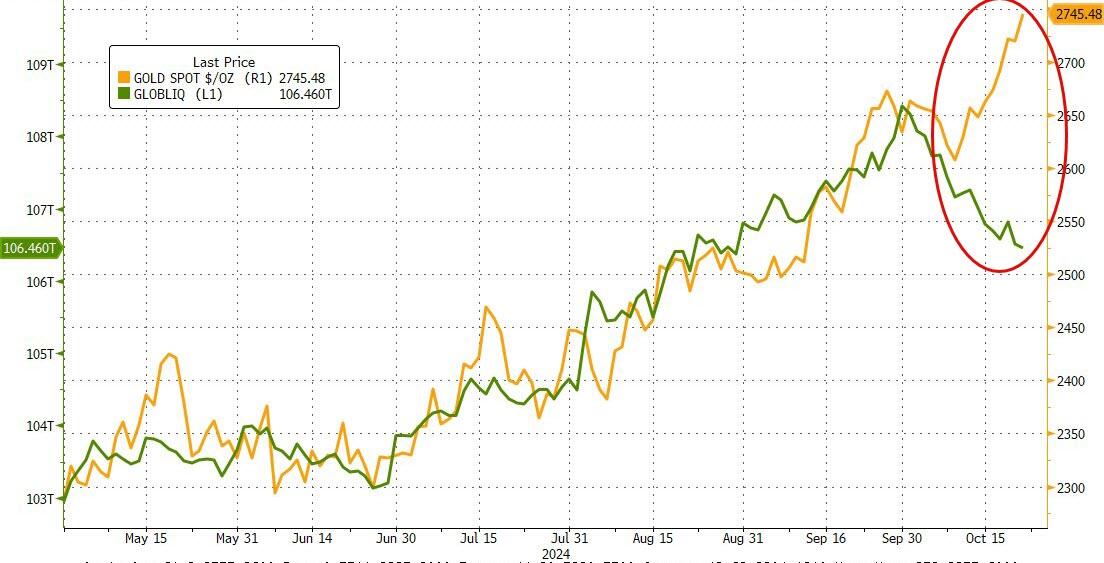
Interestingly, as gold prices continue to accelerate, global liquidity (M2) has diverged and moved in the opposite direction.
Will gold be able to rise to this challenge?
2. Current “Buy” Cycles (effective 11/21/2023)
Our Trend Tracking Indexes (TTIs) have both crossed their trend lines with enough strength to trigger new “Buy” signals. That means, Tuesday, 11/21/2023, was the official date for these signals.
If you want to follow our strategy, you should first decide how much you want to invest based on your risk tolerance (percentage of allocation). Then, you should check my Thursday StatSheet and Saturday’s “ETFs on the Cutline” report for suitable ETFs to buy.
3. Trend Tracking Indexes (TTIs)
The major indexes endured an initial decline, spending most of the trading session attempting to recover from their early losses. Despite the overall market showing more red than green by the end of the day, the declines were relatively minor.
Our TTIs also saw a slight retreat, but they continue to remain firmly positioned above their respective trend lines, indicating a stable long-term market trend.
This is how we closed 10/22/2024:
Domestic TTI: +7.90% above its M/A (prior close +8.42%)—Buy signal effective 11/21/2023.
International TTI: +6.06% above its M/A (prior close +6.34%)—Buy signal effective 11/21/2023.
All linked charts above are courtesy of Bloomberg via ZeroHedge.
———————————————————-
WOULD YOU LIKE TO HAVE YOUR INVESTMENTS PROFESSIONALLY MANAGED?
Do you have the time to follow our investment plans yourself? If you are a busy professional who would like to have his portfolio managed using our methodology, please contact me directly to get more details.
Contact Ulli