
ETF Tracker StatSheet
You can view the latest version here.
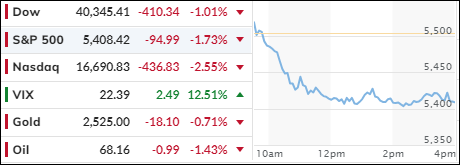
MARKET TURMOIL: NO SAFE HAVEN AS EQUITIES AND COMMODITIES PLUNGE
- Moving the market
A weaker-than-expected jobs report immediately dragged the major indexes into negative territory after the opening bell. The Dow initially held up better than its counterparts but eventually succumbed to bearish sentiment.
The Nasdaq led the decline, with mega-cap stocks being heavily sold off as traders began to question their growth potential. This shift in sentiment marked a change from the previous trend where bad news was often interpreted as good news.
The latest jobs data presented a mixed picture. August payrolls came in at 142,000, slightly below the anticipated 165,000. Additionally, the July figure was revised downward to 89,000, making today’s number appear more significant—until it too is potentially revised.
On the positive side, the unemployment rate dipped from 4.3% to 4.2%, aligning with expectations. Despite the mixed data, it wasn’t poor enough to justify a 0.5% rate cut at the upcoming Federal Reserve meeting, as some had speculated. A 0.25% cut is now fully priced in.
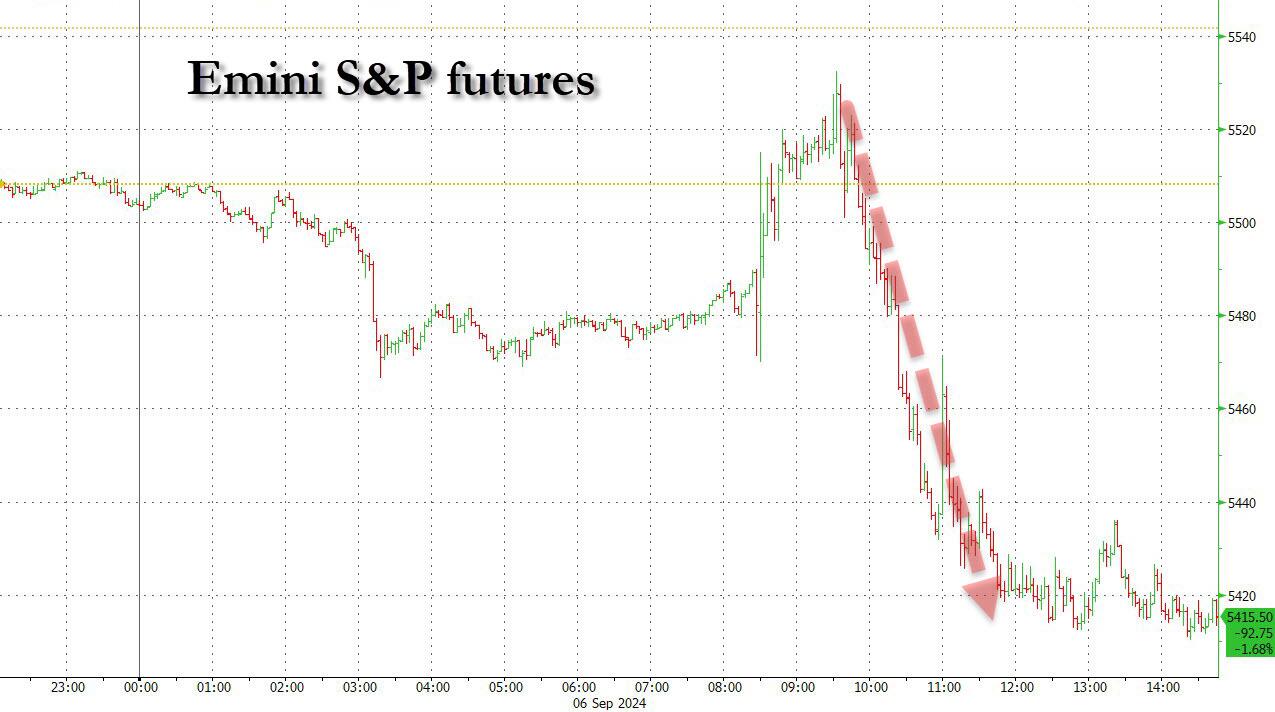
The markets reacted negatively, with traders entering sell mode, exacerbating the outcome of an already dismal, holiday-shortened week. This week now appears to be the worst since April, with the S&P 500 dropping 4.25%.
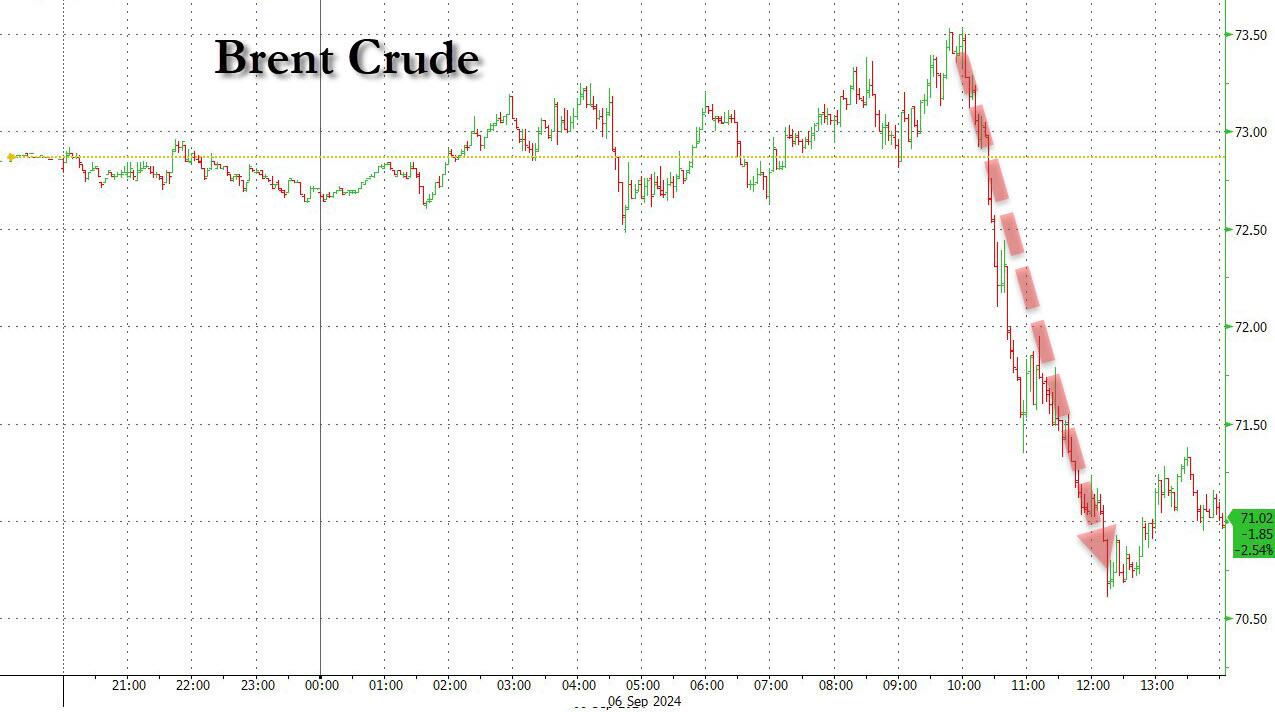
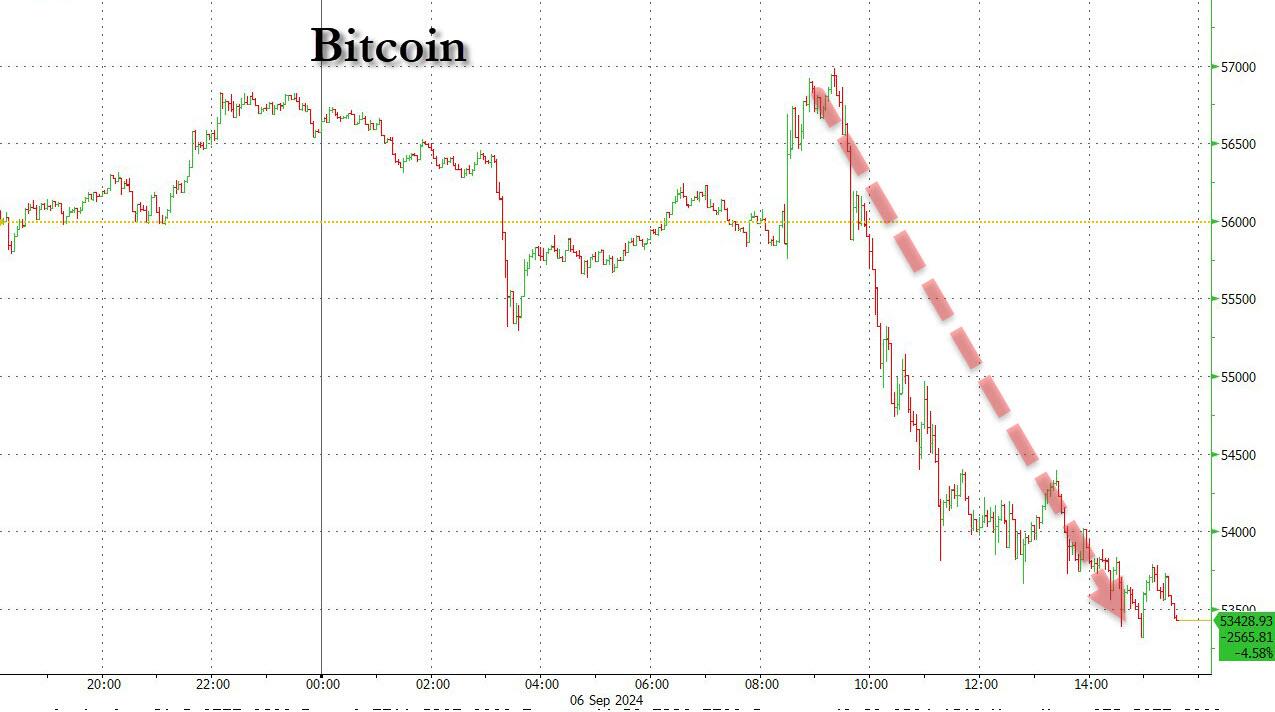
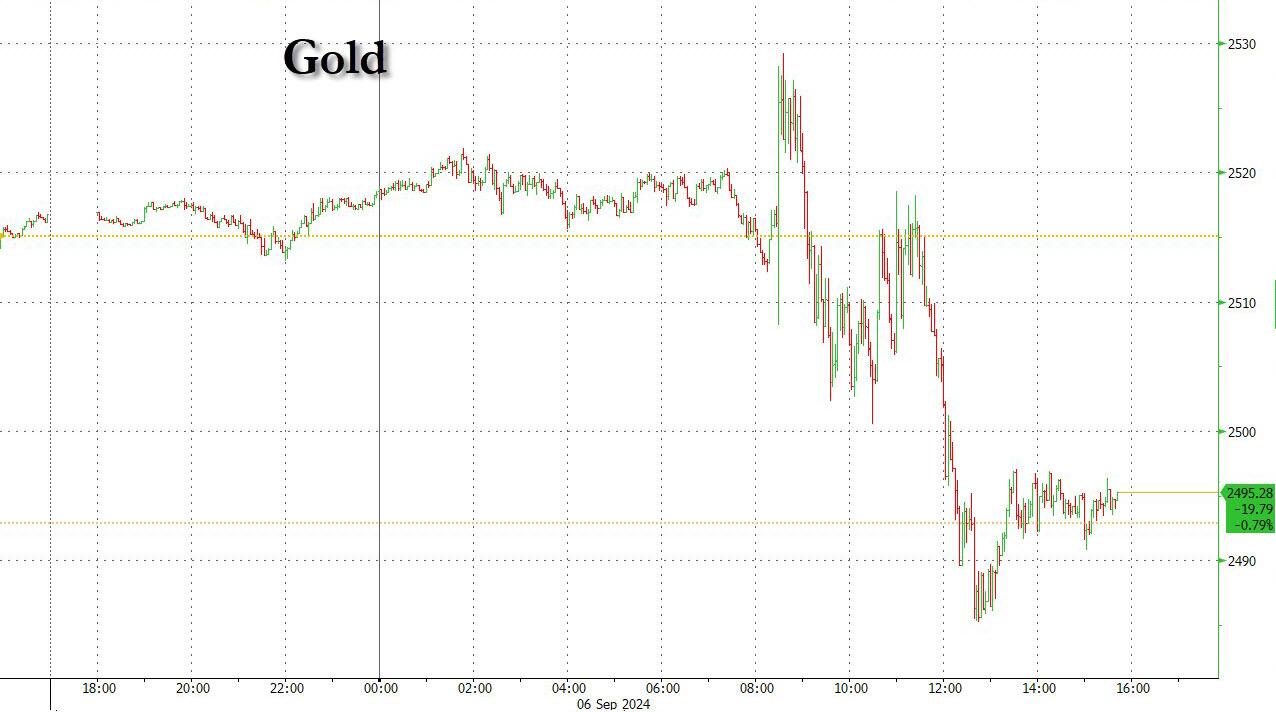
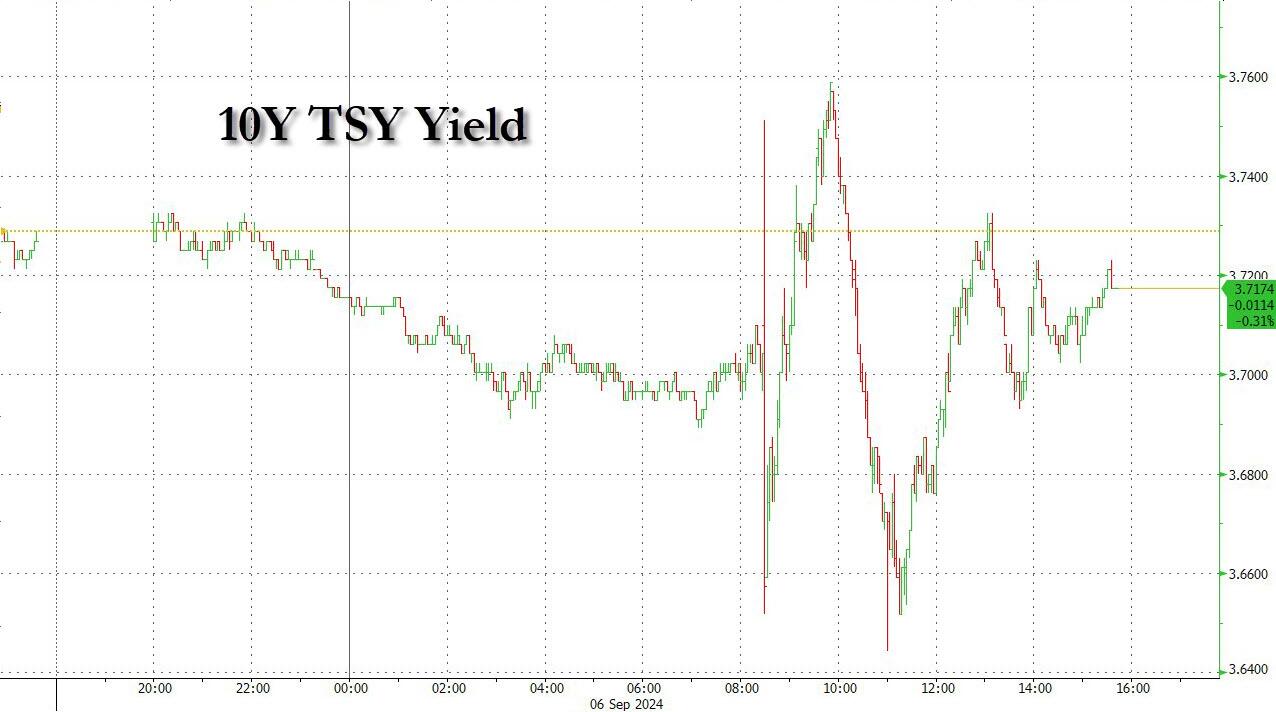
There was no “safe haven” as every asset class ended the week on a downtick. The S&P 500, crude oil, Bitcoin, and even gold was unable to escape the downturn. Bond yields fluctuated, with the 10-year yield pulling back slightly, although the market reaction suggested just the opposite.
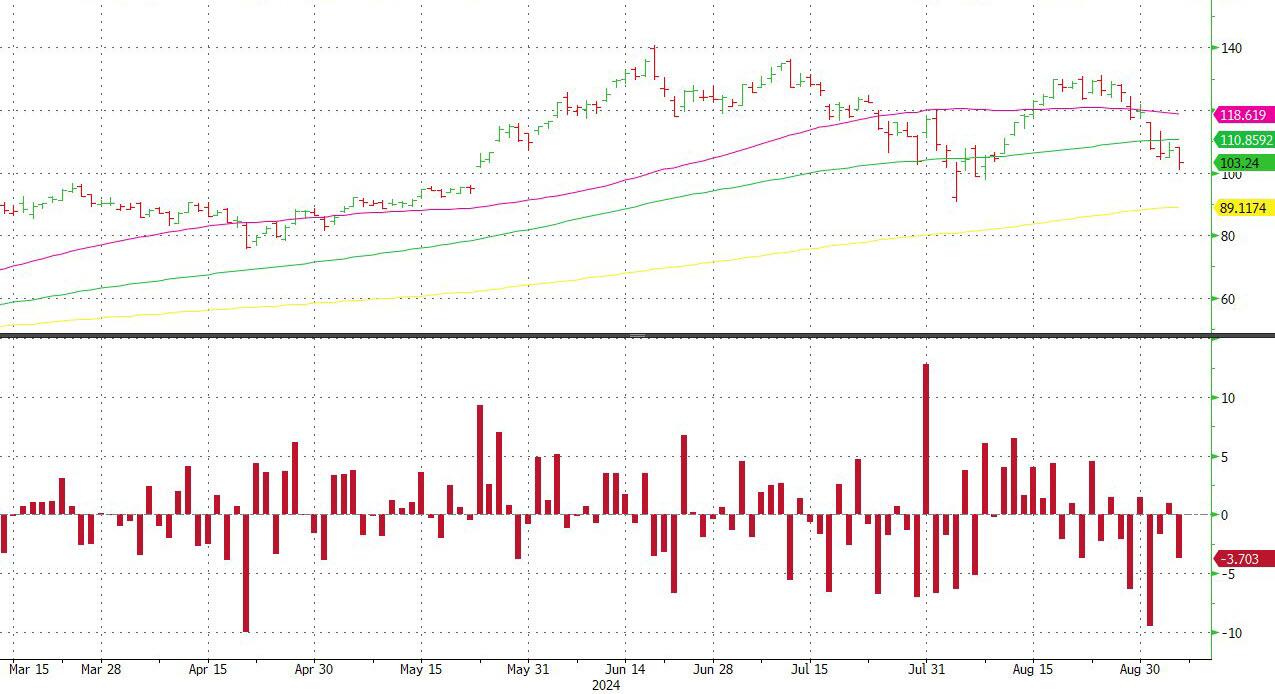
Even tech favorite Nvidia continued its decline, now down more than 30% from its June all-time high, with the MAG7 basket following closely behind.
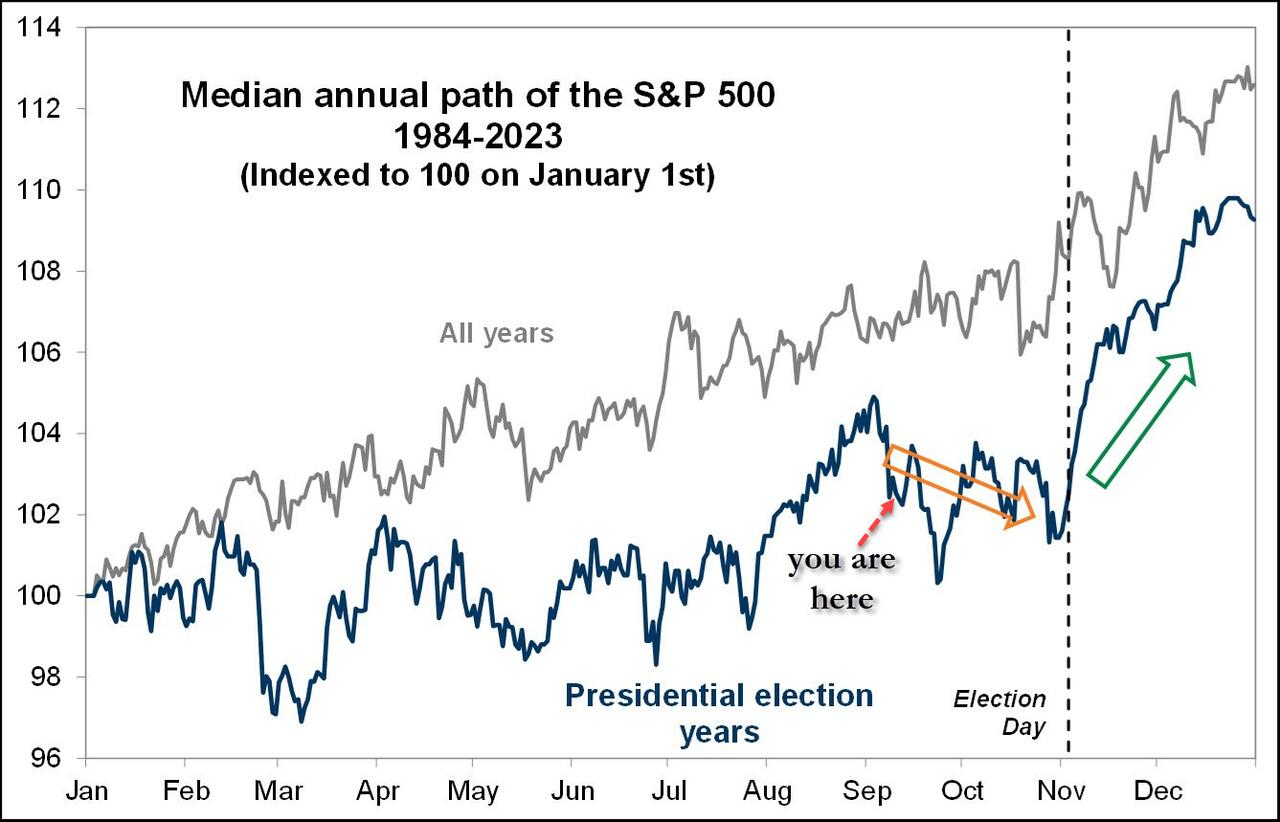
While history may not always repeat itself, traders are hopeful for a year-end rally, as suggested by a Goldman Sachs chart showing potential post-election gains.
But can we really count on this rally, or is it wiser to have an exit strategy in place?
2. Current “Buy” Cycles (effective 11/21/2023)
Our Trend Tracking Indexes (TTIs) have both crossed their trend lines with enough strength to trigger new “Buy” signals. That means, Tuesday, 11/21/2023, was the official date for these signals.
If you want to follow our strategy, you should first decide how much you want to invest based on your risk tolerance (percentage of allocation). Then, you should check my Thursday StatSheet and Saturday’s “ETFs on the Cutline” report for suitable ETFs to buy.
3. Trend Tracking Indexes (TTIs)
The week concluded in much the same way it began, with equities taking a significant hit. This downturn mirrored the severe losses experienced during the first week of August, affecting all asset classes across the board.
Due to this widespread decline, our TTIs also pulled back but managed to stay on the bullish side of their respective trend lines. This resilience suggests a continued positive outlook despite the overall market turbulence.
This is how we closed 09/06/2024:
Domestic TTI: +4.36% above its M/A (prior close +5.85%)—Buy signal effective 11/21/2023.
International TTI: +4.01% above its M/A (prior close +5.76%)—Buy signal effective 11/21/2023.
All linked charts above are courtesy of Bloomberg via ZeroHedge.
———————————————————-
WOULD YOU LIKE TO HAVE YOUR INVESTMENTS PROFESSIONALLY MANAGED?
Do you have the time to follow our investment plans yourself? If you are a busy professional who would like to have his portfolio managed using our methodology, please contact me directly to get more details.
Contact Ulli