
ETF Tracker StatSheet
You can view the latest version here.
DOLLAR DECLINES, GOLD AND BITCOIN RALLY AMID GLOBAL MARKET VOLATILITY
- Moving the market
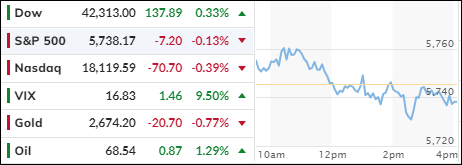
The latest inflation report bolstered the optimistic outlook, suggesting that economic conditions were not as dire as anticipated. This pushed the major indexes higher, with all three concluding the week in the green. However, only the Dow managed a small gain for the day, while the S&P 500 and Nasdaq faded into the close.
The Fed’s preferred inflation measure, the Personal Consumption Expenditure (PCE) price index, increased by 0.1% in August, aligning with expectations. Its annualized pace rose by 2.2%, slightly better than the forecasted 2.3%.
This fueled hopes for continued improvements, potentially easing borrowing costs for corporations and households. However, the impact of lower interest rates, coupled with rising debt and deficits, on future inflation has been largely overlooked.
Gold’s performance, significantly outpacing the S&P 500 year-to-date (SPY: +20.41% vs. GLD: +29.19%), highlights ongoing economic and inflationary uncertainties, creating a favorable environment for precious metals.
The MAG7 basket followed the Nasdaq’s downward trend after an initial surge, while the most shorted stocks rebounded, and bond yields showed mixed results for the week.
The dollar extended its decline for the fourth consecutive week, touching its December 2023 low. Conversely, gold rallied for the third straight week, setting new record highs before pulling back today. Bitcoin mirrored this trend, reaching its long-lost $66k level.
The sharp rallies in gold and Bitcoin reflect global uncertainties. US sovereign risk of default is escalating, as highlighted by Zero Hedge.
Does this mean the Fed’s aggressive 0.5% rate cut played a role to possibly contain these extreme market movements?
2. Current “Buy” Cycles (effective 11/21/2023)
Our Trend Tracking Indexes (TTIs) have both crossed their trend lines with enough strength to trigger new “Buy” signals. That means, Tuesday, 11/21/2023, was the official date for these signals.
If you want to follow our strategy, you should first decide how much you want to invest based on your risk tolerance (percentage of allocation). Then, you should check my Thursday StatSheet and Saturday’s “ETFs on the Cutline” report for suitable ETFs to buy.
3. Trend Tracking Indexes (TTIs)
On the second to last trading day of September, the market opened on a positive note. However, as the session progressed, sentiment waned, resulting in a mixed close. Among the major indexes, only the Dow managed to eke out a gain by the end of the day.
Meanwhile, our TTIs showed divergence; both ended the day higher, but the domestic TTI showed greater strength compared to its counterpart.
This is how we closed 09/27/2024:
Domestic TTI: +8.86% above its M/A (prior close +8.44%)—Buy signal effective 11/21/2023.
International TTI: +8.94% above its M/A (prior close +8.87%)—Buy signal effective 11/21/2023.
All linked charts above are courtesy of Bloomberg via ZeroHedge.
———————————————————-
WOULD YOU LIKE TO HAVE YOUR INVESTMENTS PROFESSIONALLY MANAGED?
Do you have the time to follow our investment plans yourself? If you are a busy professional who would like to have his portfolio managed using our methodology, please contact me directly to get more details.
Contact Ulli