
ETF Tracker StatSheet
You can view the latest version here.
GOLD OUTSHINES S&P 500 YTD AS TRADERS EYE FED’S NEXT MOVE
- Moving the market
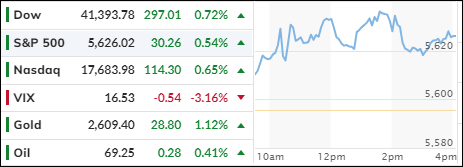
Despite the S&P 500 still being down for the month, it just completed a five-day winning streak, recovering most of the early September losses. The index gained over 4% this week, with the Dow and Nasdaq also making significant comebacks.
Traders are now turning their attention to next week’s Federal Reserve meeting, which concludes on Wednesday. The Central Bank is expected to cut rates by 0.25%, reducing the current target rate of 5.25%. The question remains whether the market will follow the adage “buy the rumor, sell the news” after the emotional buildup leading to this event.
While Wall Street exudes optimism about inflation and the economy, the reality appears starkly different. Store closures, record bankruptcies, and layoffs paint a grim picture, with consumers grappling with high credit card debt and low savings amid rising prices.
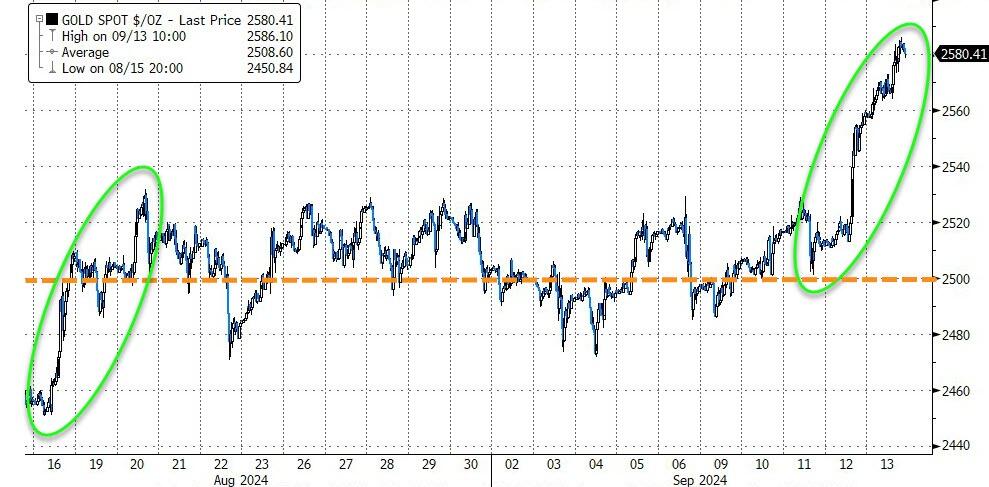
In my view, any rate reduction signals the Fed’s attempt to “save” the economy, which could further fuel inflationary trends. This is evidenced by the rising gold prices, which have outperformed the S&P 500 year-to-date by a substantial margin (24.85% vs. 18.24%).
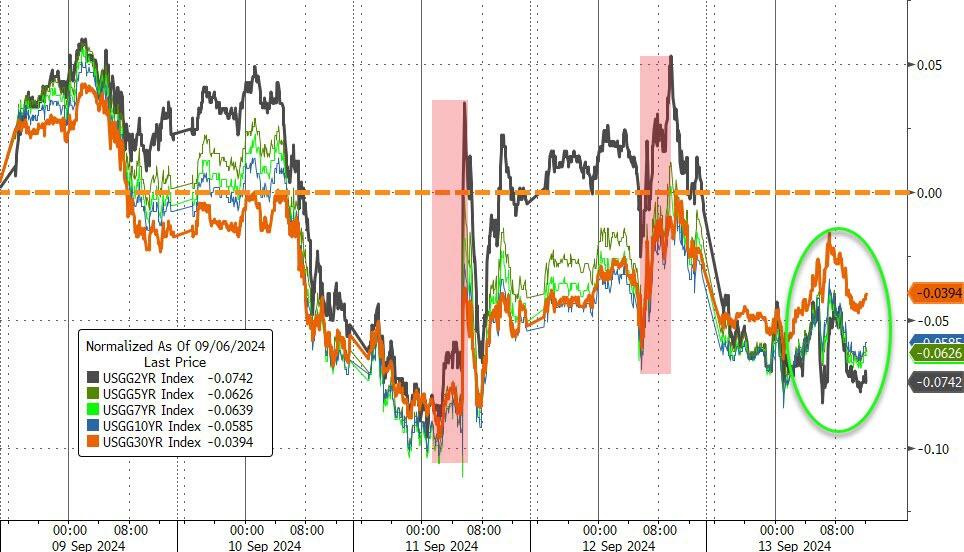
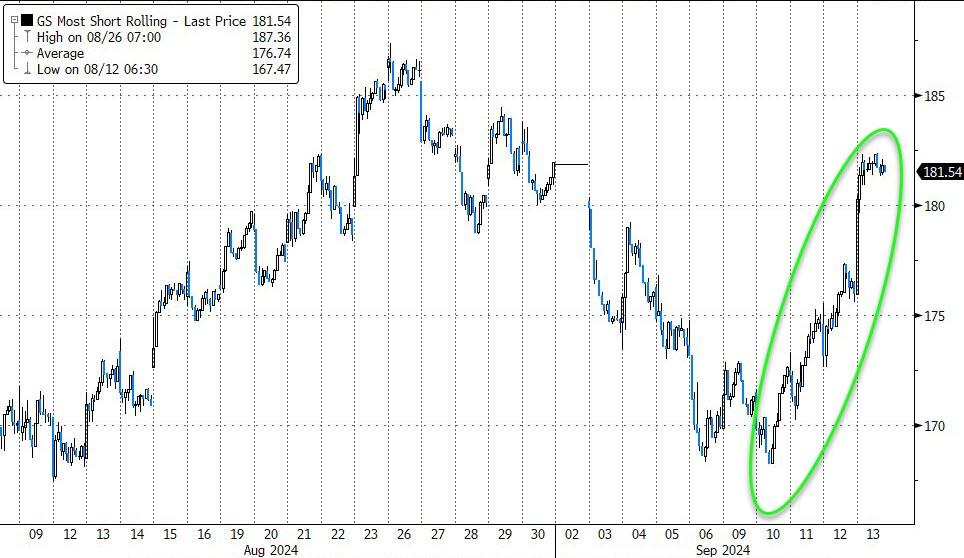
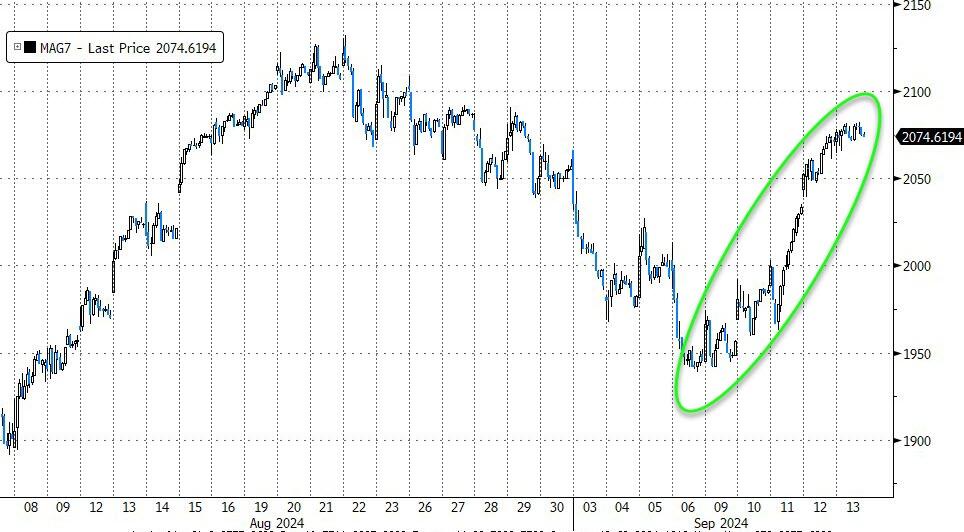
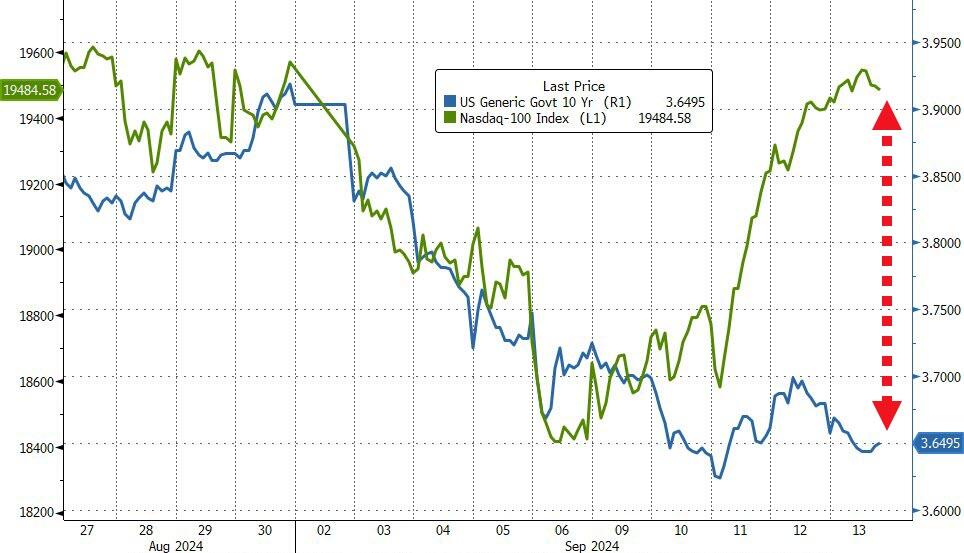
Bond yields ended the week lower, while most shorted stocks and the MAG 7 basket soared every trading day. However, stocks diverged from bonds.
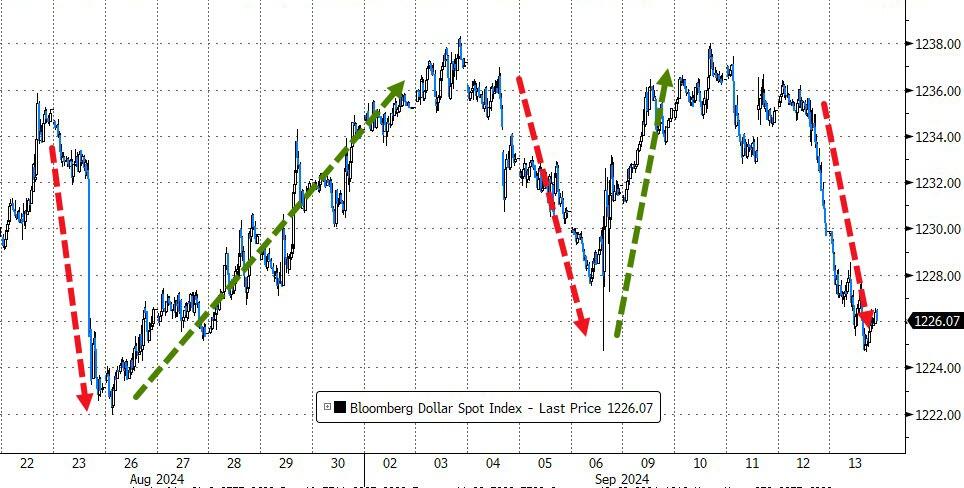
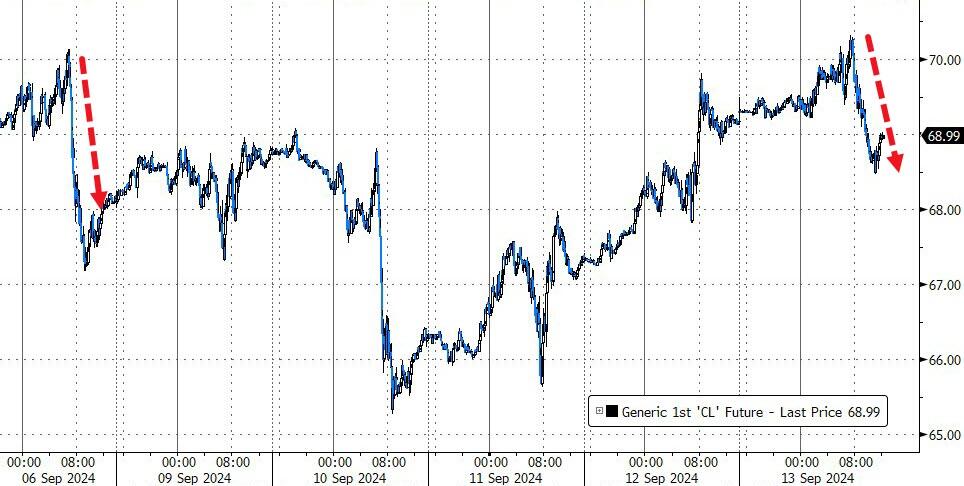
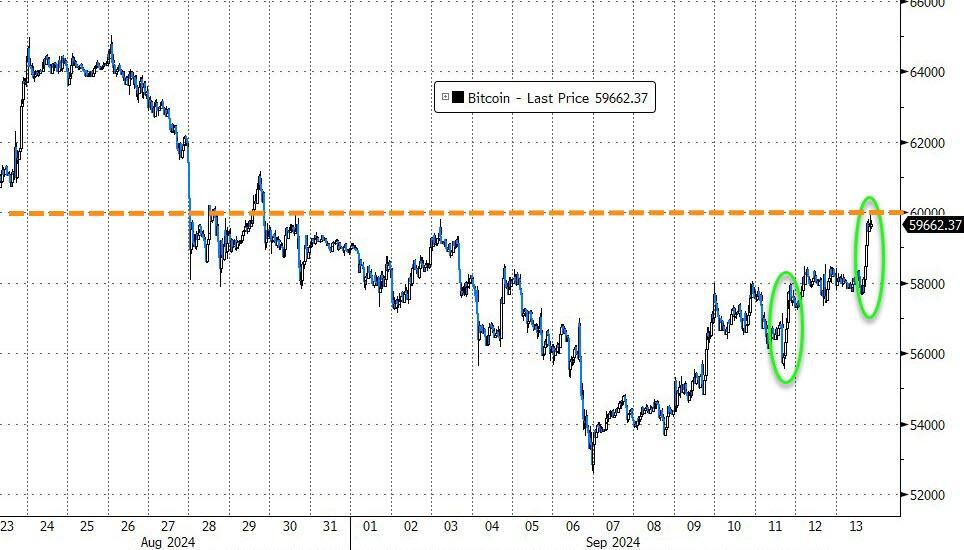
The dollar suffered its sixth down week out of seven, boosting gold to a new record high and its best week in five months. Oil prices dropped today but rose for the week, while Bitcoin surged to its best week in two months, touching the $60k level.
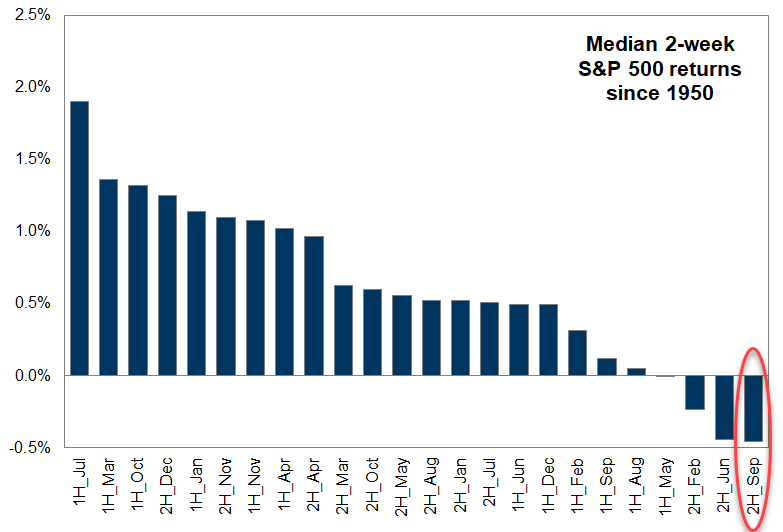
Traders were almost giddy about this week’s comeback, but it remains to be seen if Fed Chair Powell’s anticipated rate cut can overcome seasonal tendencies, which suggest we are entering the market’s worst two-week period of the year.
Will history repeat itself?
2. Current “Buy” Cycles (effective 11/21/2023)
Our Trend Tracking Indexes (TTIs) have both crossed their trend lines with enough strength to trigger new “Buy” signals. That means, Tuesday, 11/21/2023, was the official date for these signals.
If you want to follow our strategy, you should first decide how much you want to invest based on your risk tolerance (percentage of allocation). Then, you should check my Thursday StatSheet and Saturday’s “ETFs on the Cutline” report for suitable ETFs to buy.
3. Trend Tracking Indexes (TTIs)
Throughout the trading session, the major indexes maintained a consistent upward trajectory, concluding in another positive close. This performance effectively erased most of the losses incurred during the previous week.
Additionally, our TTIs also experienced an uptick, enhancing their position compared to a week ago.
This is how we closed 09/13/2024:
Domestic TTI: +6.81% above its M/A (prior close +6.13%)—Buy signal effective 11/21/2023.
International TTI: +5.82% above its M/A (prior close +5.68%)—Buy signal effective 11/21/2023.
All linked charts above are courtesy of Bloomberg via ZeroHedge.
———————————————————-
WOULD YOU LIKE TO HAVE YOUR INVESTMENTS PROFESSIONALLY MANAGED?
Do you have the time to follow our investment plans yourself? If you are a busy professional who would like to have his portfolio managed using our methodology, please contact me directly to get more details.
Contact Ulli