
- Moving the market
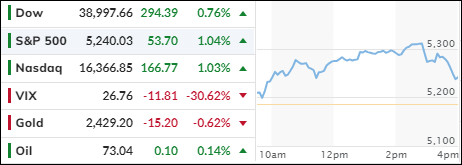
After the intense selling pressure during the first three trading days of August, which drove the S&P 500 down by over 6%, equities rebounded today, recovering some of their losses. Whether this marks the end of the downturn or is merely a relief bounce remains uncertain.
The tech sector also saw a recovery, with major players like Nvidia and Meta advancing, although Apple continued to show weakness, losing 1%. Contributing to the renewed bullish sentiment was a rebound in Japanese stocks, following the Nikkei index’s worst day since the 1987 crash.
Volatility is likely to remain high, and this correction may be far from over. Concerns about the state of the economy persist, and the Japanese carry trade is still unwinding. This could lead to further market pressure in the coming weeks, with ongoing worries about inflation, debt, and deficits adding to the uncertainty.
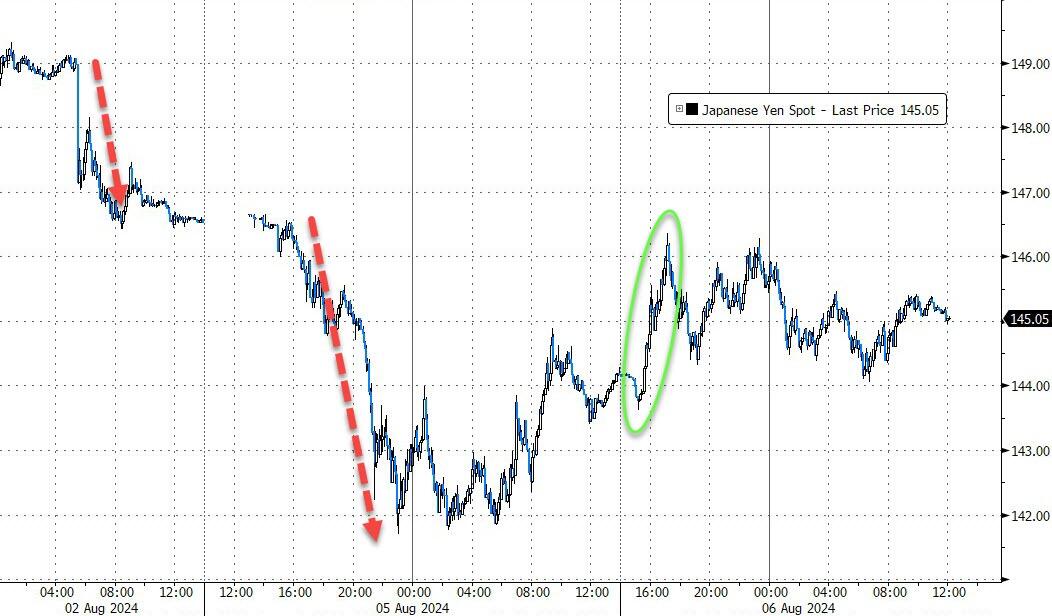
Given these circumstances, reducing exposure to more volatile sectors in favor of less volatile ones seems prudent. The Japanese Yen continued its rebound from yesterday’s lows, prompting speculation that the Bank of Japan may have quietly intervened to provide support.
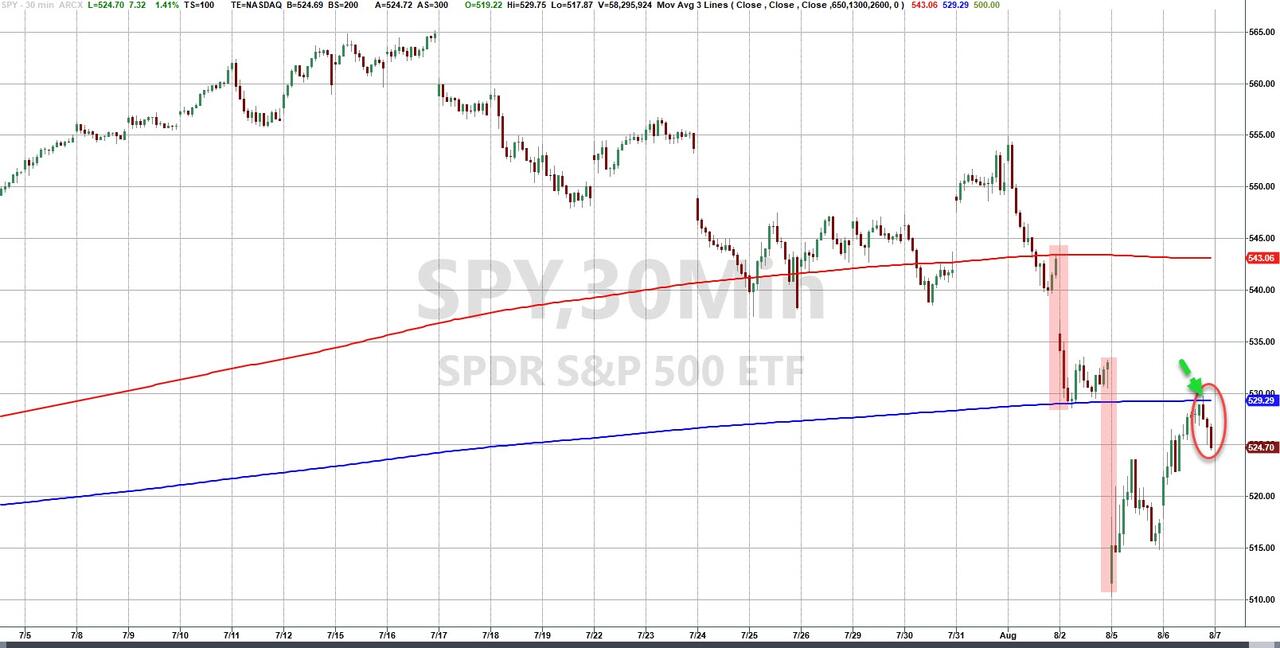
This turnaround Tuesday also benefited the major indexes, with the S&P 500 receiving a boost from algorithms that lifted the index to its 100-day moving average, only to reverse direction at that level.
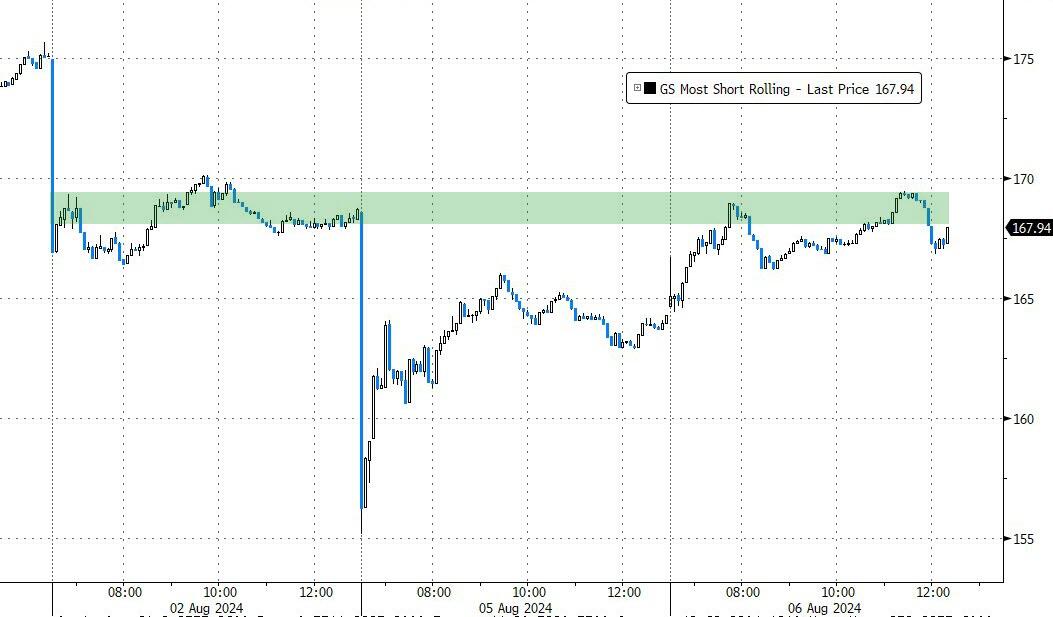
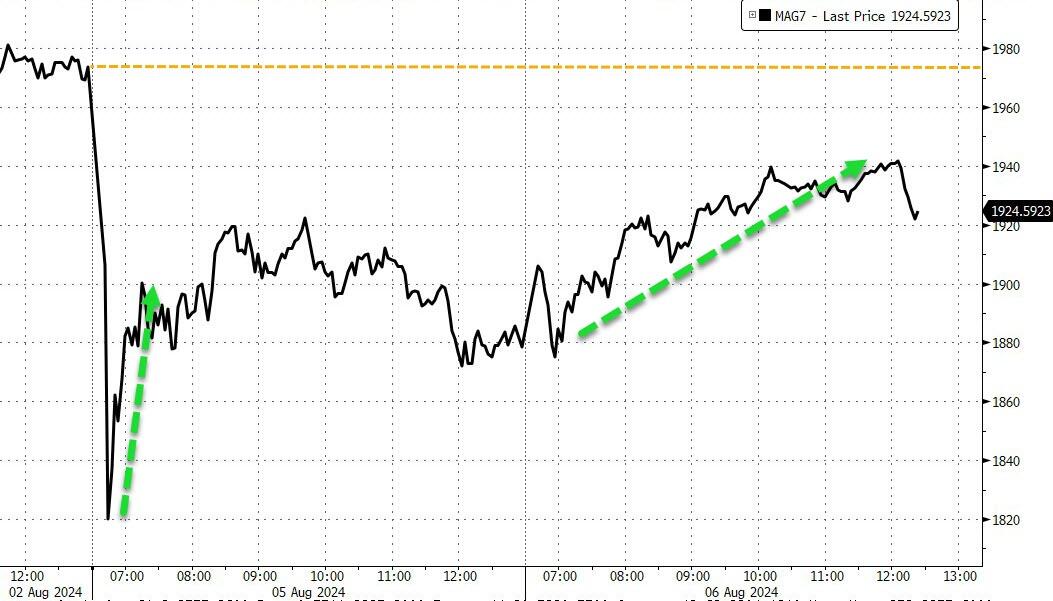
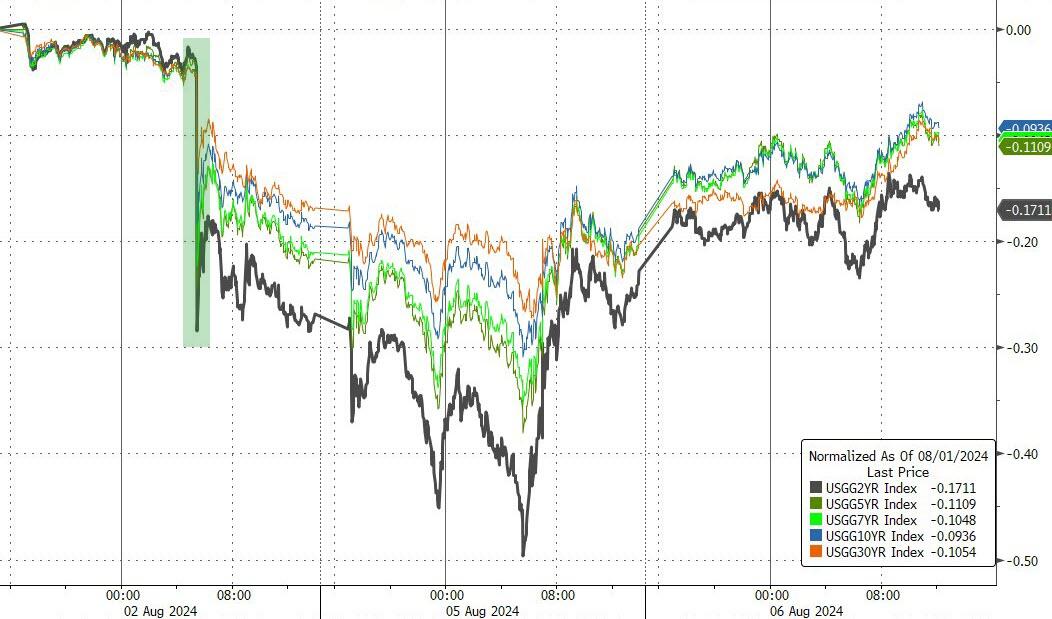
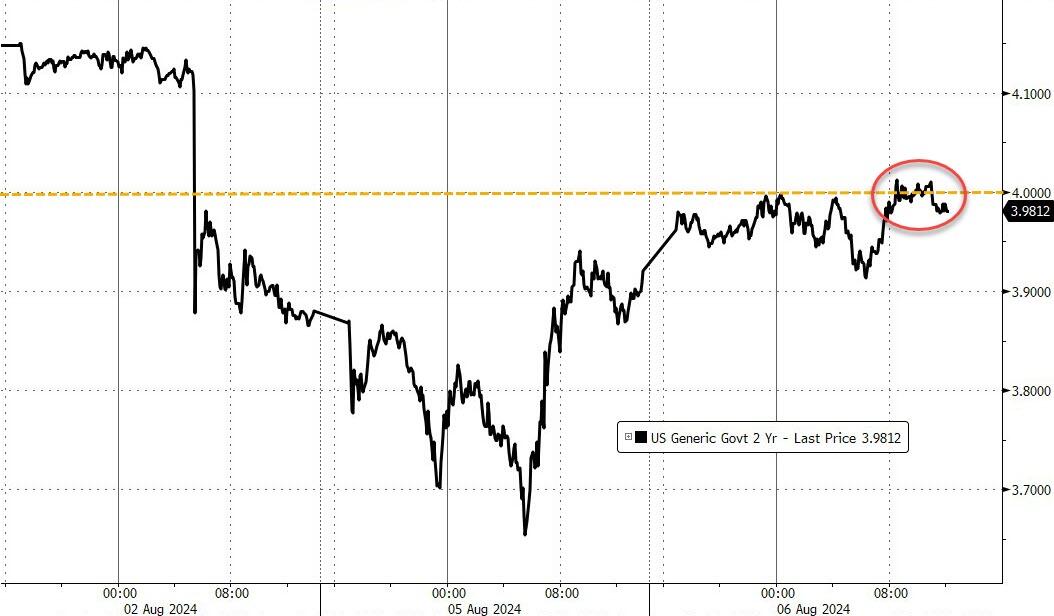
The most shorted stocks experienced a squeeze but encountered overhead resistance. The MAG7 basket made a comeback but fell short of reaching yesterday’s starting point. Bond yields rallied, with the 2-year yield testing the 4% level again.
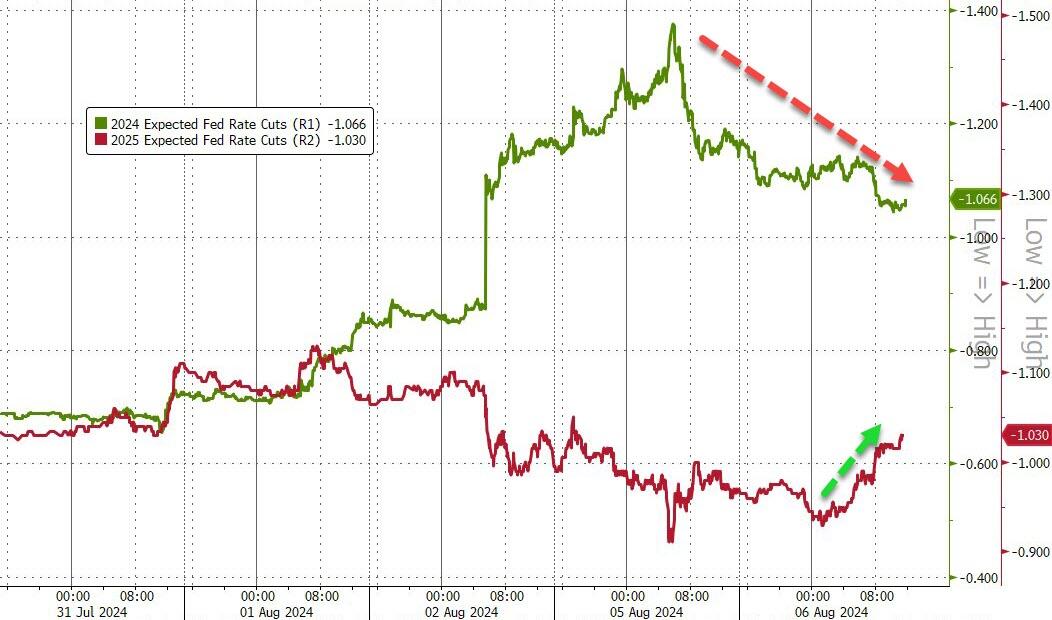
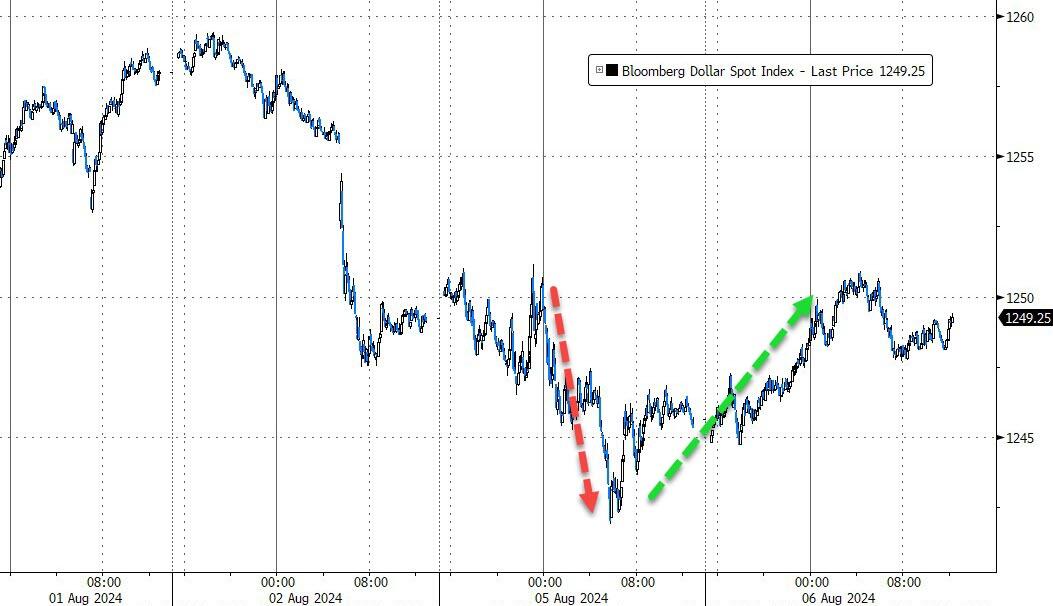
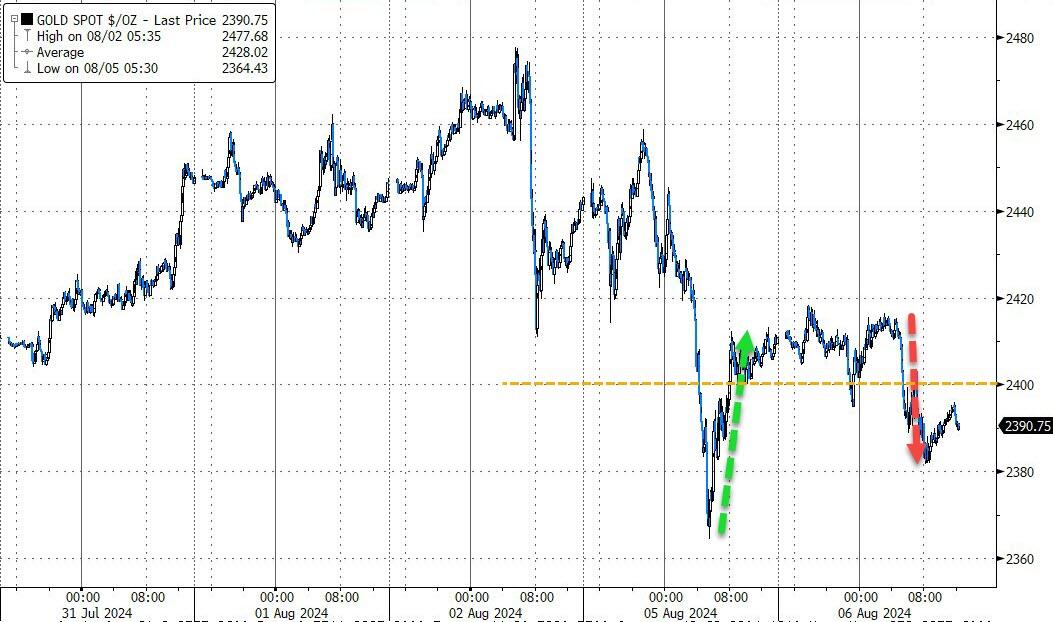
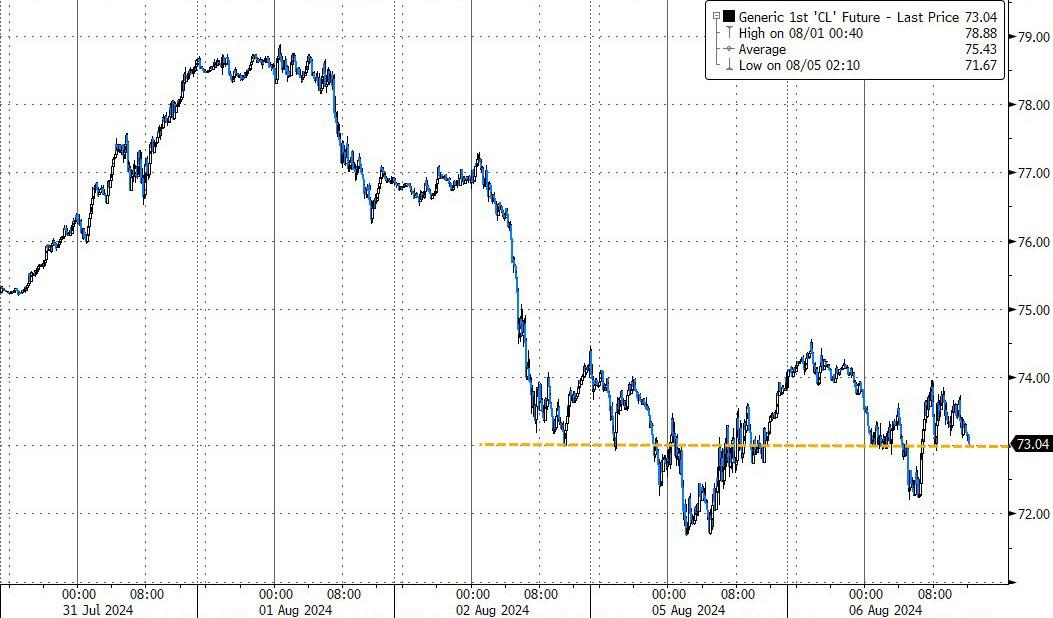
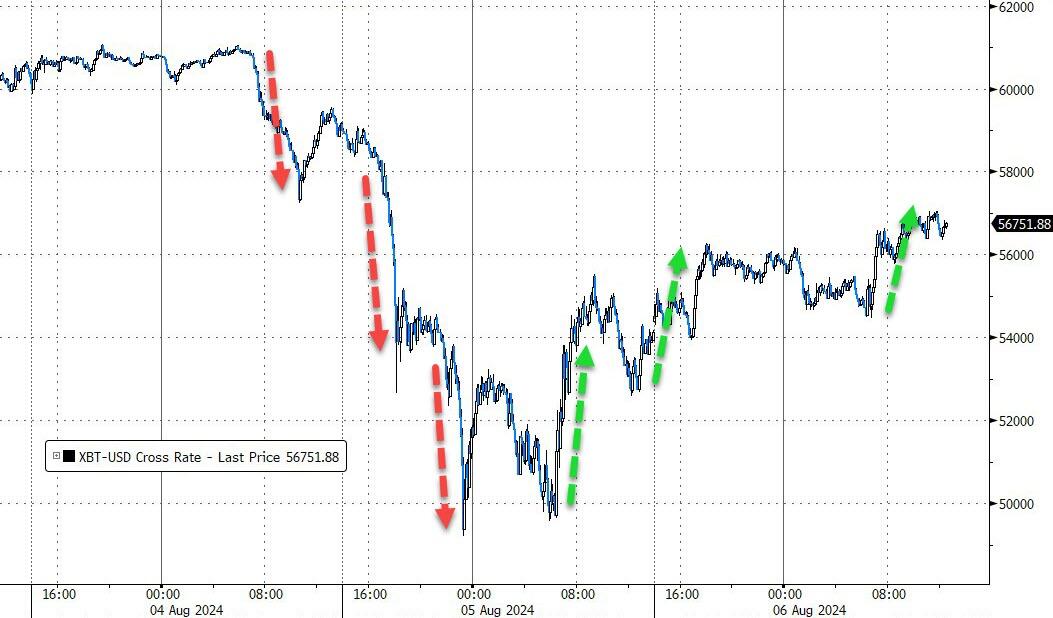
Meanwhile, rate-cut expectations dropped, the dollar staged a comeback, and gold temporarily surrendered its $2,400 level. Crude oil slipped, but Bitcoin bounced higher, testing its $57k level and advancing by 6%.
Bloomberg summed up an old cliché about turnaround Tuesdays:
“The bad news is such recoveries don’t guarantee a bottom has been reached.”
2. Current “Buy” Cycles (effective 11/21/2023)
Our Trend Tracking Indexes (TTIs) have both crossed their trend lines with enough strength to trigger new “Buy” signals. That means, Tuesday, 11/21/2023, was the official date for these signals.
If you want to follow our strategy, you should first decide how much you want to invest based on your risk tolerance (percentage of allocation). Then, you should check my Thursday StatSheet and Saturday’s “ETFs on the Cutline” report for suitable ETFs to buy.
3. Trend Tracking Indexes (TTIs)
Although a turnaround Tuesday doesn’t necessarily signal the end of a sell-off, it did provide traders with some much-needed relief.
The broad market managed to recover from the significant drawdown sustained the previous day. While some of the losses were recouped, it’s important to note that the market did not maintain its intraday highs.
Our TTIs showed improvement, with the international TTI climbing back above its trend line.
This is how we closed 08/06/2024:
Domestic TTI: +2.44% above its M/A (prior close +1.81%)—Buy signal effective 11/21/2023.
International TTI: +0.26% below its M/A (prior close -0.62%)—Buy signal effective 11/21/2023.
All linked charts above are courtesy of Bloomberg via ZeroHedge.
———————————————————-
WOULD YOU LIKE TO HAVE YOUR INVESTMENTS PROFESSIONALLY MANAGED?
Do you have the time to follow our investment plans yourself? If you are a busy professional who would like to have his portfolio managed using our methodology, please contact me directly to get more details.
Contact Ulli