
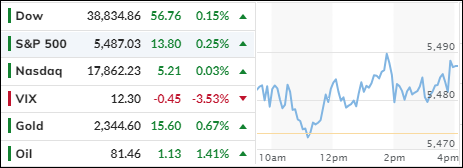
- Moving the markets
The major indexes opened slightly higher despite disappointing retails sales. While they rose 0.1% in May, expectations were for a more solid 0.2%. This latest result is a sign that consumer demand is weakening, and this 0.1% growth may simply have been the result of inflation.
Rising consumer demand is critical for the markets, because without it this bull market will eventually fall flat on its face. After all, consumer activity accounts for some 67% of economic growth and is a key component for corporate profits. Offsetting this weakness, however, was strong industrial production.
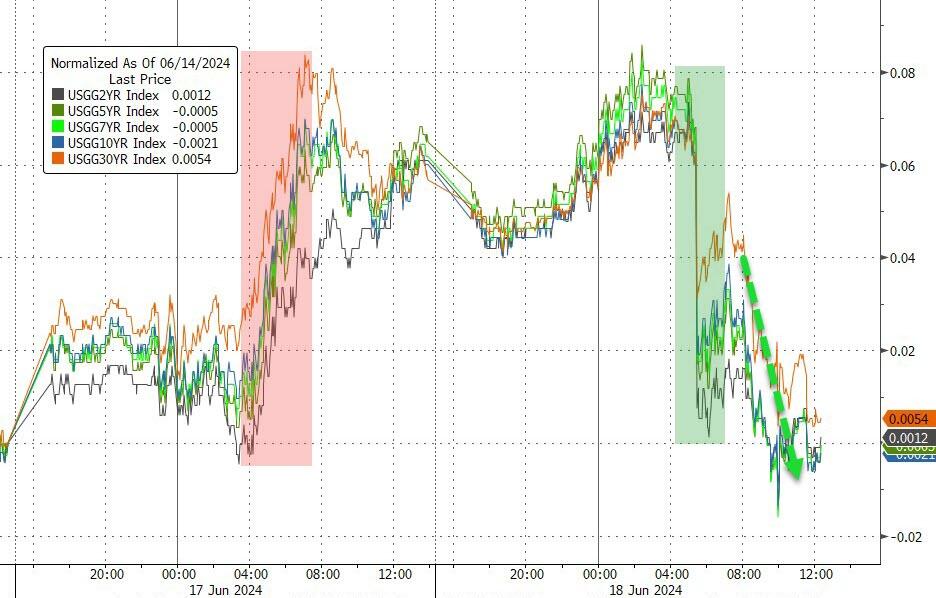
Still, bond yields slipped, and traders focused right away on the wishful theme that this slowdown may persuade the Fed to shift policy gears and lean towards cutting rates.
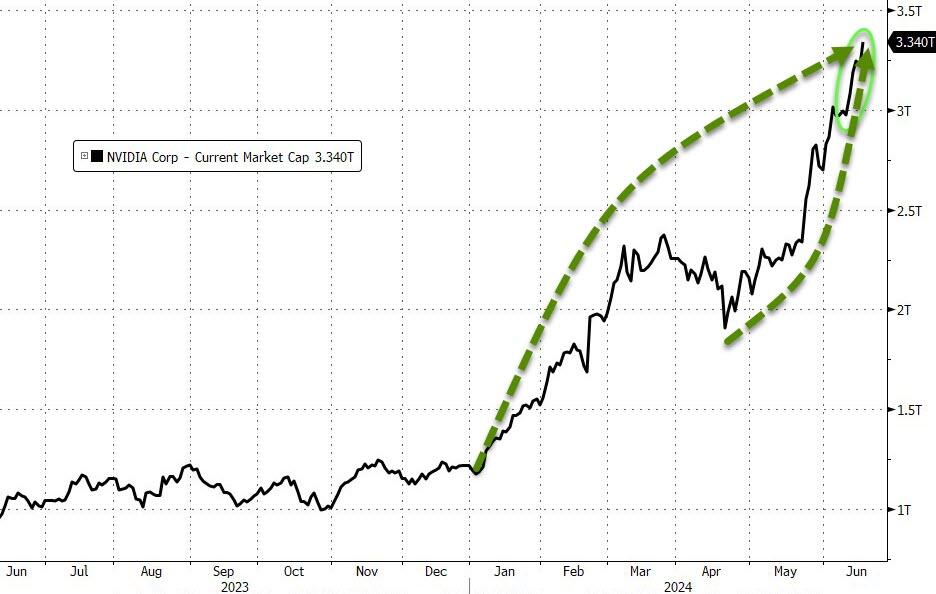
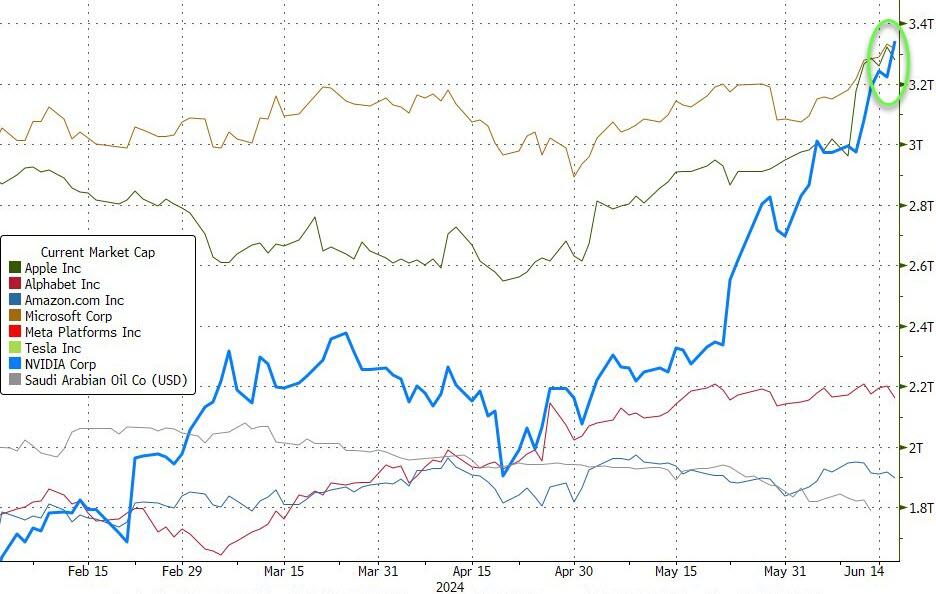
The indexes eked out another green close with the S&P 500 rising to a new record, as tech darling Nvidia also marched towards new highs, in the process surpassing Microsoft as the most valuable public company.
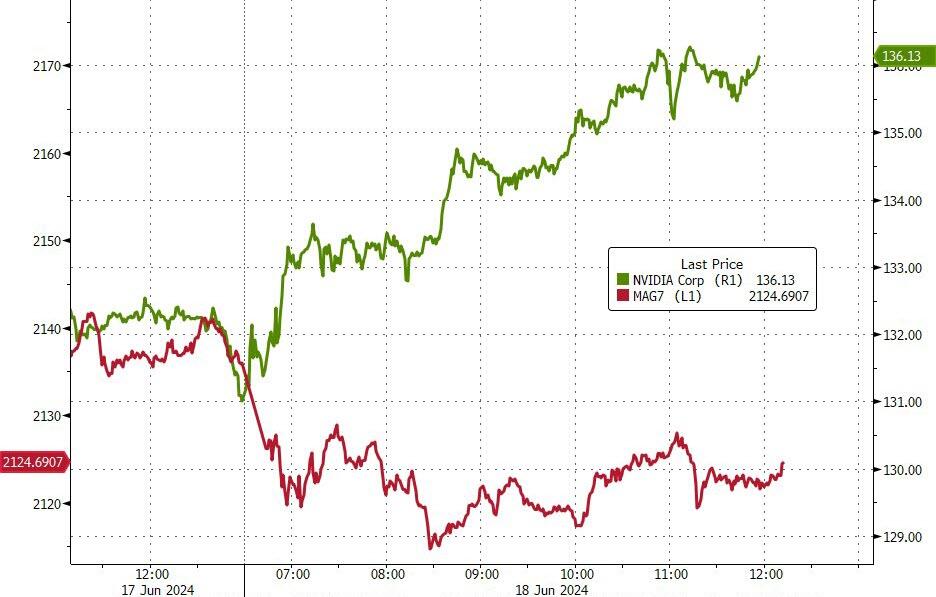
Interestingly, the Mag 7 stocks faded with ZH noting togue in cheek that the markets have now become the “Magnificent One.”
A variety of the Fed mouthpieces appeared, but their opinions on rate cuts were a mixed bag and did not influence market direction, but rate-cut expectations rose during the session.
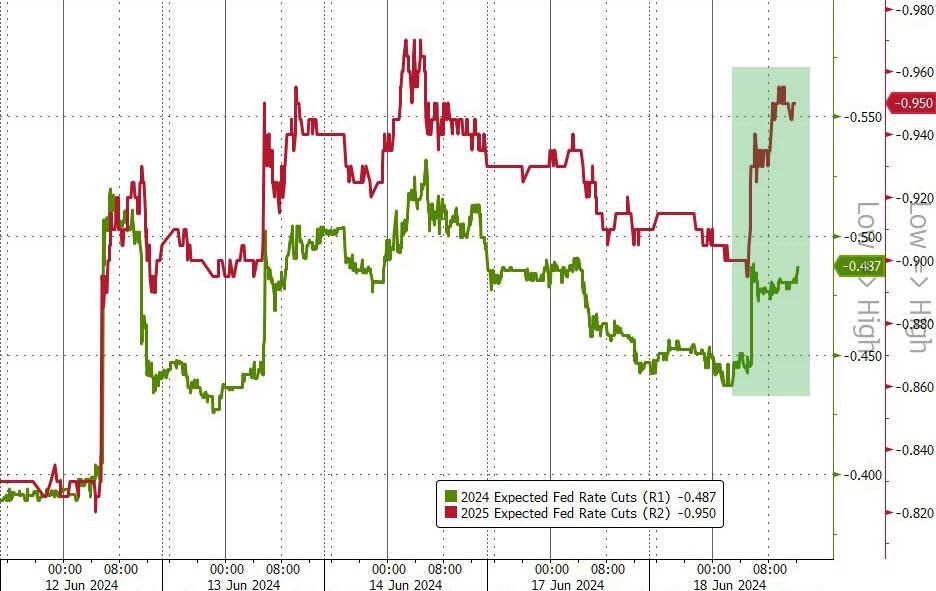
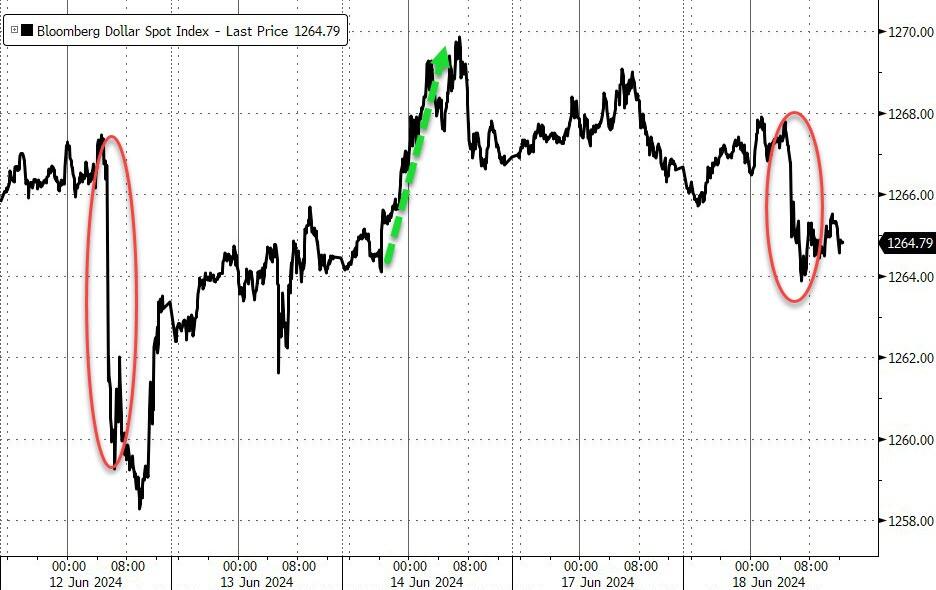
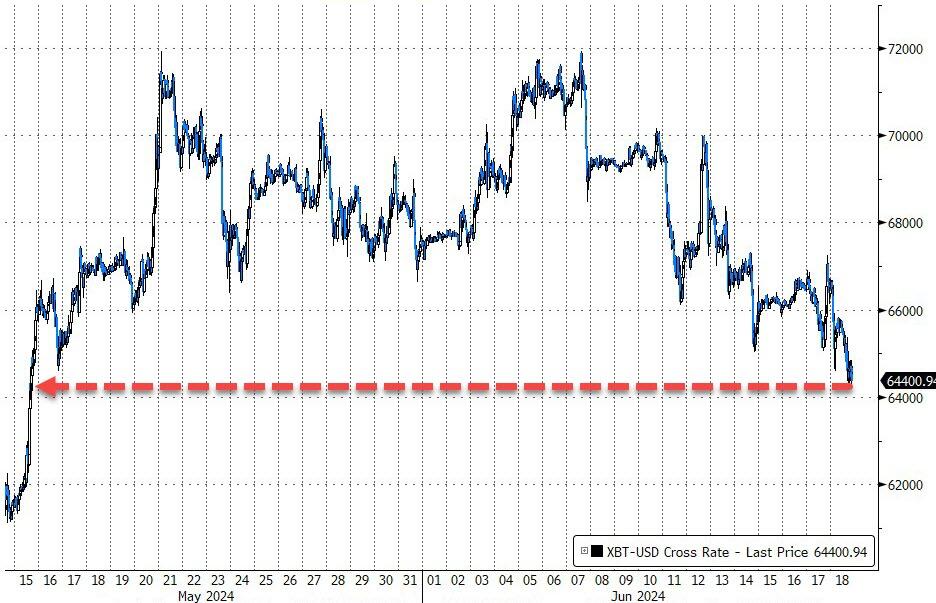
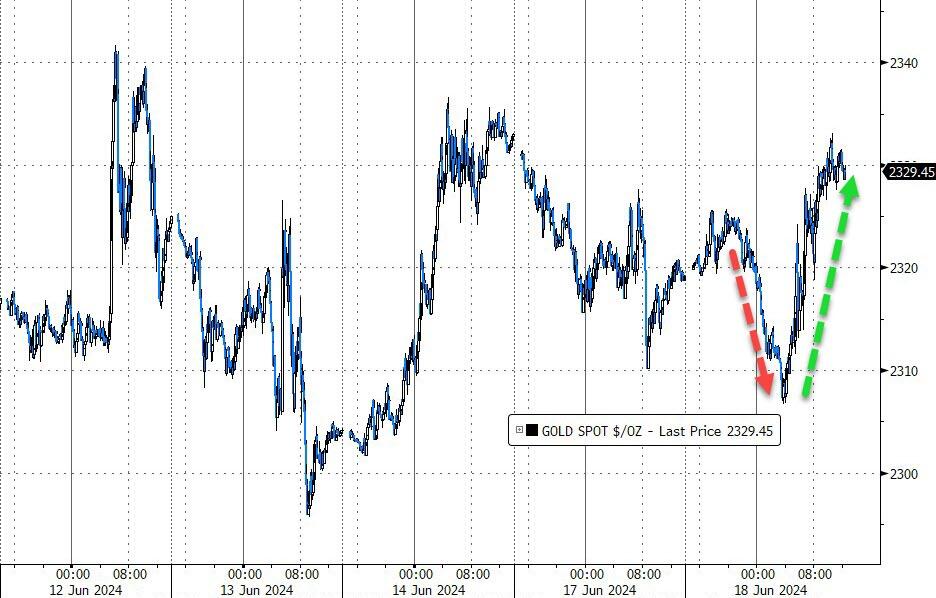
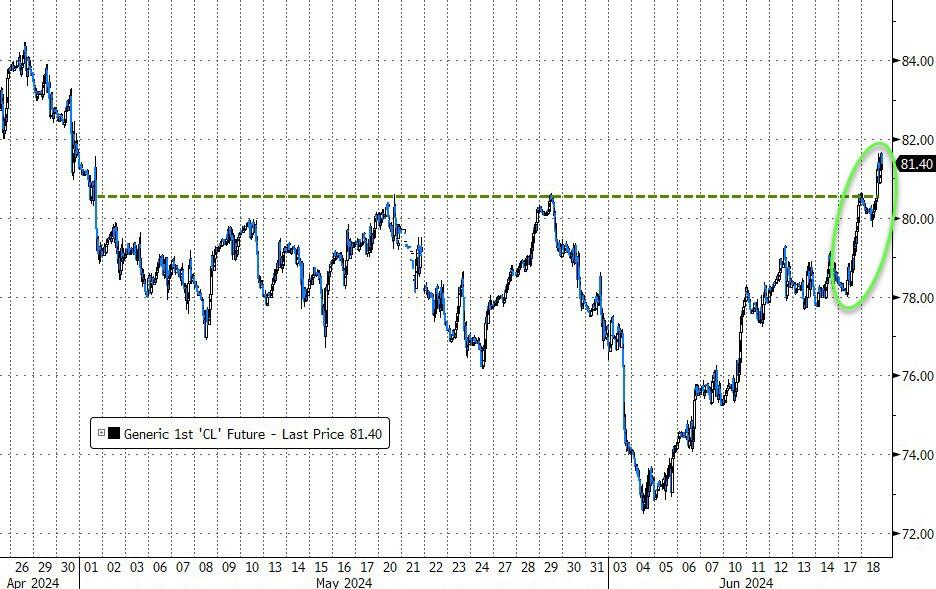
The most shorted stocks remained in their 3-day sideways range, as bond yields fell and the dollar dipped. Bitcoin continued to break down by heading towards its $64k level, while gold slid at first but then rallied into the close. Crude oil extended its gains and headed towards $82.
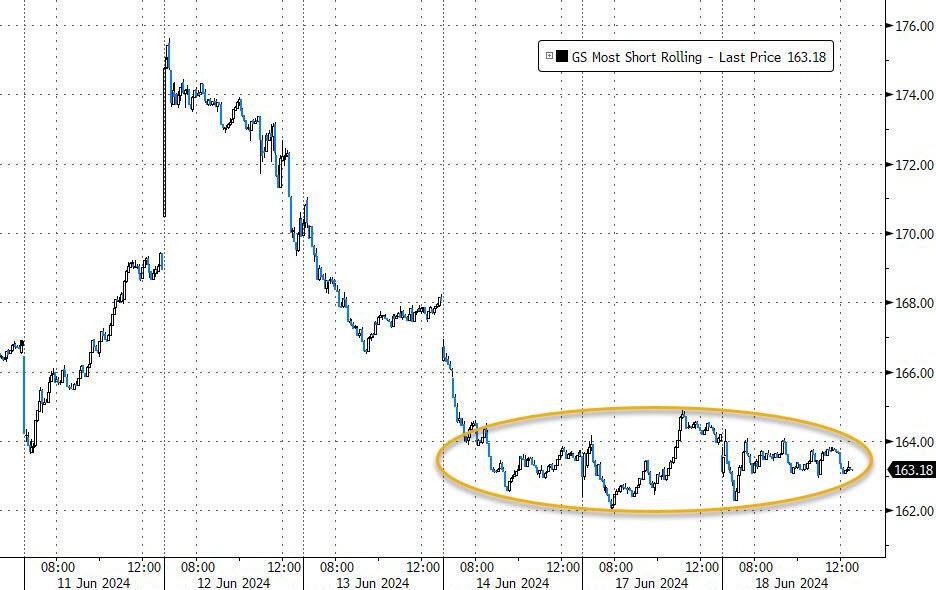
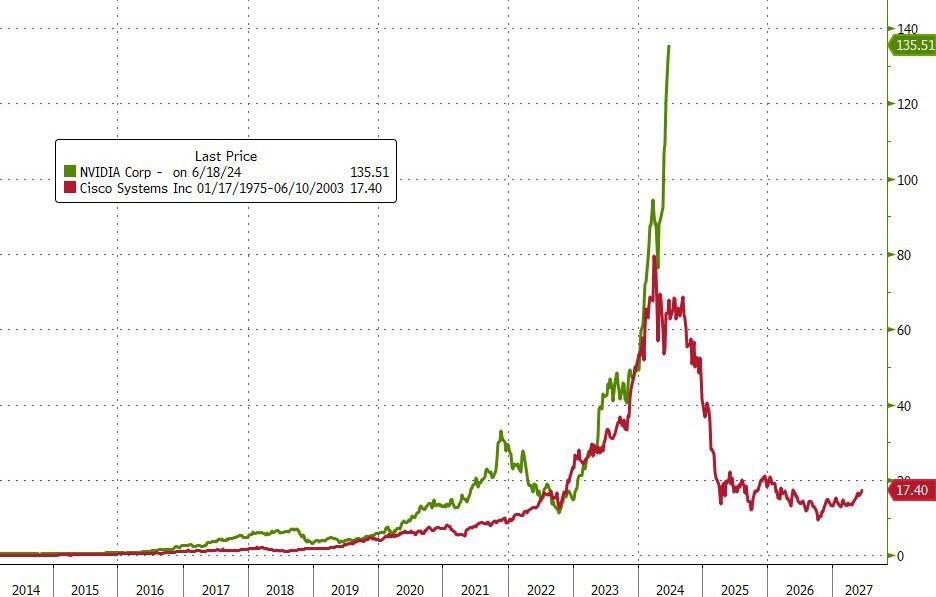
With Nvidia’s relentless climb into uncharted territory, I wonder how long this will last…
Are we seeing a turbo-charged replay of the dotcom bubble?
2. Current “Buy” Cycles (effective 11/21/2023)
Our Trend Tracking Indexes (TTIs) have both crossed their trend lines with enough strength to trigger new “Buy” signals. That means, Tuesday, 11/21/2023, was the official date for these signals.
If you want to follow our strategy, you should first decide how much you want to invest based on your risk tolerance (percentage of allocation). Then, you should check my Thursday StatSheet and Saturday’s “ETFs on the Cutline” report for suitable ETFs to buy.
3. Trend Tracking Indexes (TTIs)
Despite disappointing retail sales, traders felt relief that this might persuade the Fed to cut rates sooner than expected. That sentiment shift was enough to propel the major indexes to another green closer.
Our TTIs were in sync with the broad market and ended higher.
This is how we closed 06/18/2024:
Domestic TTI: +6.36% above its M/A (prior close +6.09%)—Buy signal effective 11/21/2023.
International TTI: +6.88% above its M/A (prior close +6.36%)—Buy signal effective 11/21/2023.
All linked charts above are courtesy of Bloomberg via ZeroHedge.
———————————————————-
WOULD YOU LIKE TO HAVE YOUR INVESTMENTS PROFESSIONALLY MANAGED?
Do you have the time to follow our investment plans yourself? If you are a busy professional who would like to have his portfolio managed using our methodology, please contact me directly to get more details.
Contact Ulli