
ETF Tracker StatSheet
You can view the latest version here.
TECH TITANS TUSSLE FOR TOP SPOT AMIDST MARKET MELT-UP AND MAIN STREET MALAISE
- Moving the markets
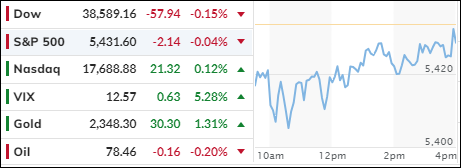
Stocks fell right after the opening, as a decline in consumer sentiment gave the bears a reason to cheer. However, the S&P 500 ended only marginally lower but gained for the week.
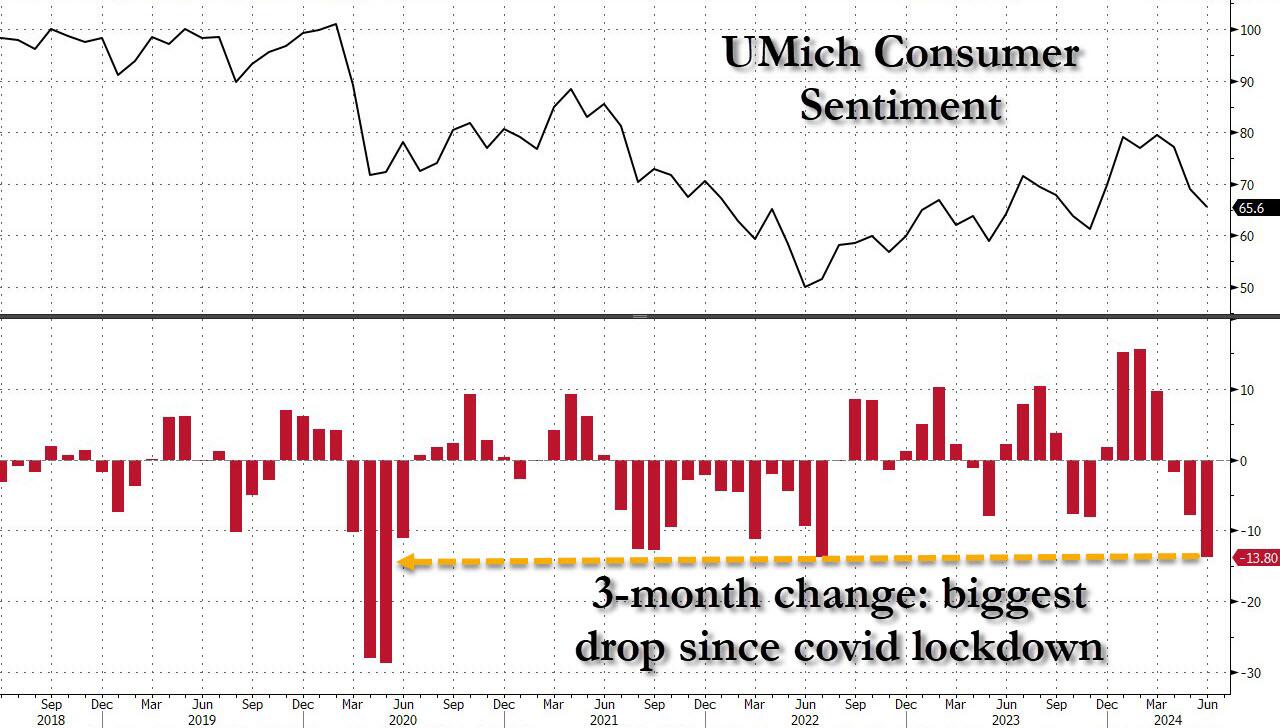
The Michigan survey of consumers confirmed that the consumer is stressed, with the sentiment declining to 65.6 in June, which represents a sharp drop from April’s number of 69.1. Worse yet, estimates were in the 71.5 range, a huge miss.
This clearly shows the disconnect between Wall Street and Main Street and dampened enthusiasm about better-than-expected CPI and PPI figures from earlier in the week. Hope of a continued cooling of inflation were the main contributors to the S&P’s and Nasdaq’s advances.
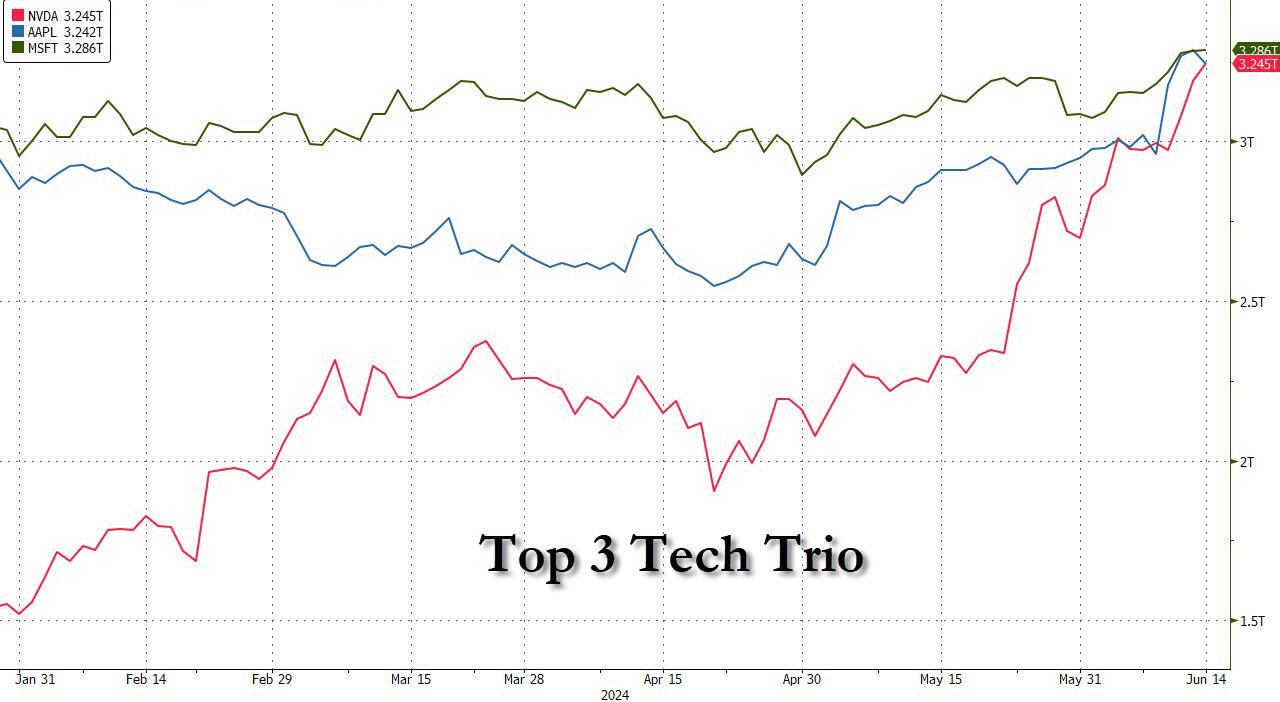
As we know, all market action has been centered around tech and its seemingly never-ending melt-up, which ZH so aptly displayed in this graphic version. The Big Three, Nvidia, Apple and Microsoft, have been taking turns and swapping their position as the #1 tech company in the world. How long can traders play this game of musical chairs, before the reality sets in that this is all one gigantic bubble?
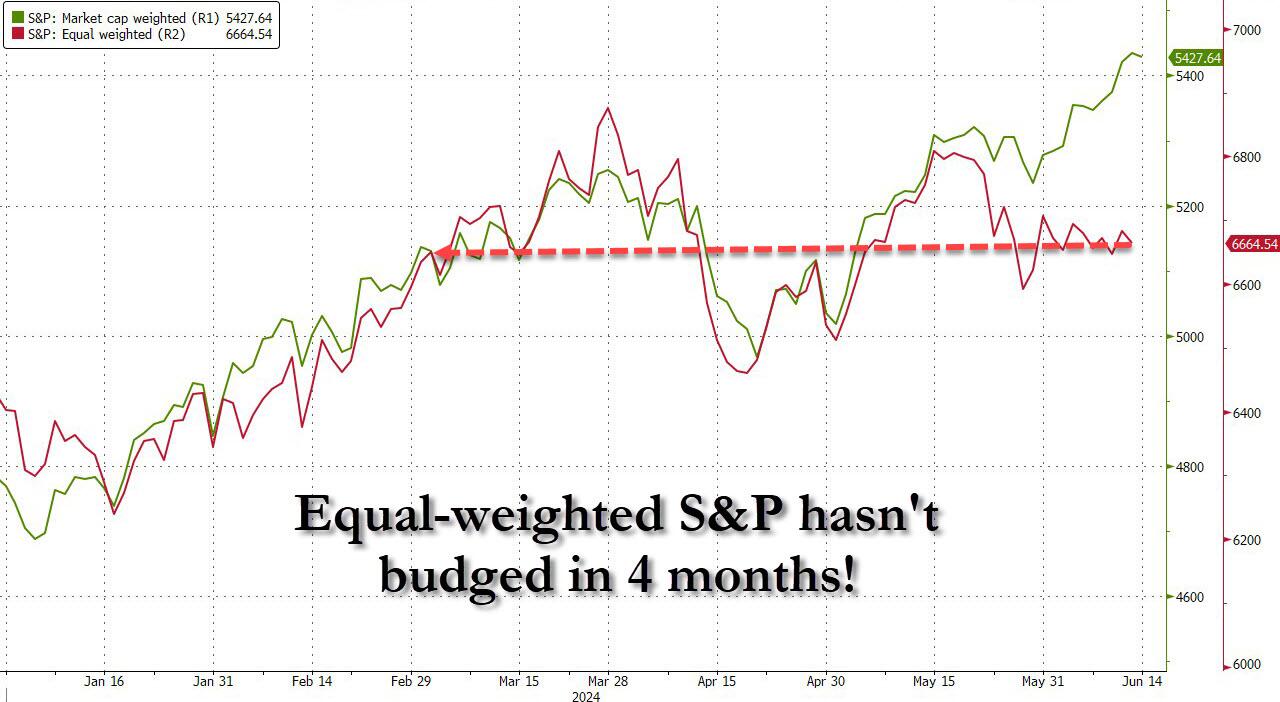
In the meantime, the broad market, as represented by the equal weight S&P index, has gone nowhere since late February. It shows the one-sidedness of the current rally, a theme that is not conducive to long-term gains.
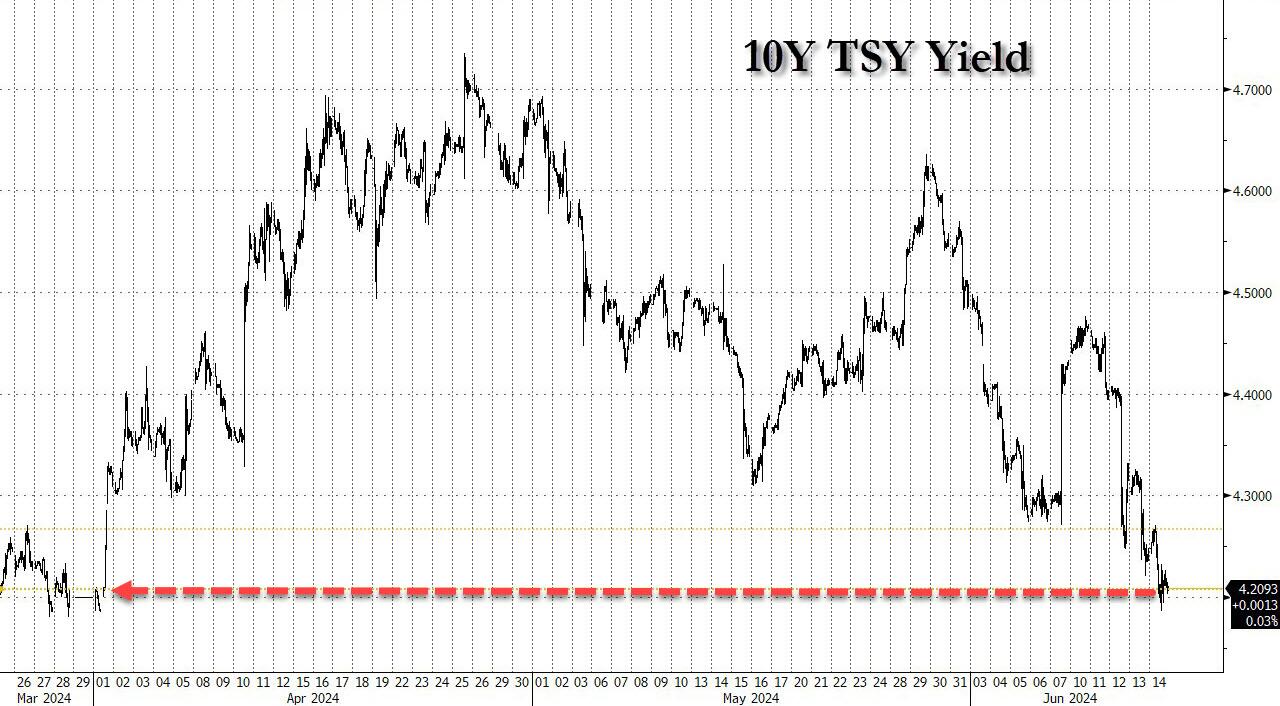
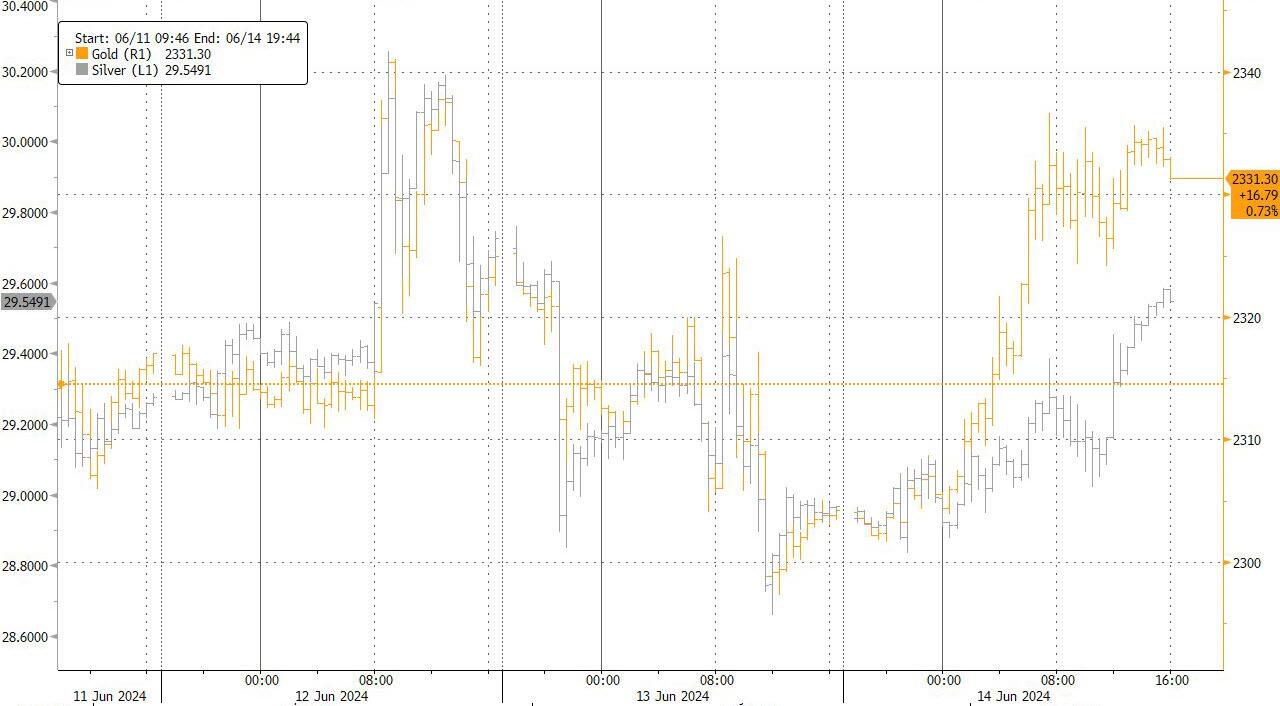
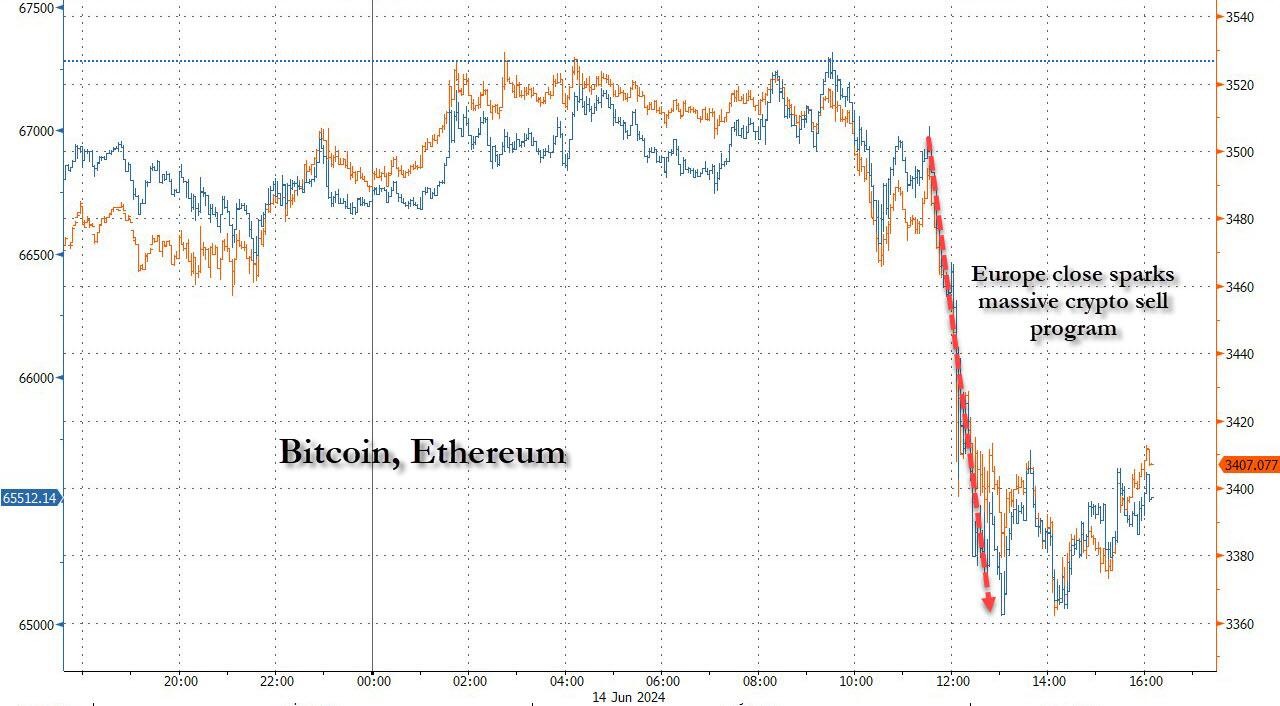
Bond yields slipped a tad with the 10-year now at its lowest level since early May. Gold and Silver closed at session highs, but cryptos were clobbered for no apparent reason.
It was a week with wild swings, but the S&P 500 and the Nasdaq managed to eke out another win and kept bullish sentiment going.
The question is “for how long?”
After all, cracks in the economy are appearing in many places and, if the Fed eventually caves in and cuts rates, it will be over for the bullish crowd.
Why?
Because the reason for the cut will not be that inflation has been conquered, it will be that the economy is in total shambles, which will be a nail in the coffin of equities.
2. Current “Buy” Cycles (effective 11/21/2023)
Our Trend Tracking Indexes (TTIs) have both crossed their trend lines with enough strength to trigger new “Buy” signals. That means, Tuesday, 11/21/2023, was the official date for these signals.
If you want to follow our strategy, you should first decide how much you want to invest based on your risk tolerance (percentage of allocation). Then, you should check my Thursday StatSheet and Saturday’s “ETFs on the Cutline” report for suitable ETFs to buy.
3. Trend Tracking Indexes (TTIs)
An early dip in the markets proved to be short-lived, as the major indexes spent the remainder of the session digging themselves out of that early hole. Only the Nasdaq Composite succeeded and scored another win.
Our TTIs went the other way and gave back some recent gains.
This is how we closed 06/14/2024:
Domestic TTI: +5.33% above its M/A (prior close +6.32%)—Buy signal effective 11/21/2023.
International TTI: +6.03% above its M/A (prior close +6.92%)—Buy signal effective 11/21/2023.
All linked charts above are courtesy of Bloomberg via ZeroHedge.
———————————————————-
WOULD YOU LIKE TO HAVE YOUR INVESTMENTS PROFESSIONALLY MANAGED?
Do you have the time to follow our investment plans yourself? If you are a busy professional who would like to have his portfolio managed using our methodology, please contact me directly to get more details.
Contact Ulli