

- Moving the markets
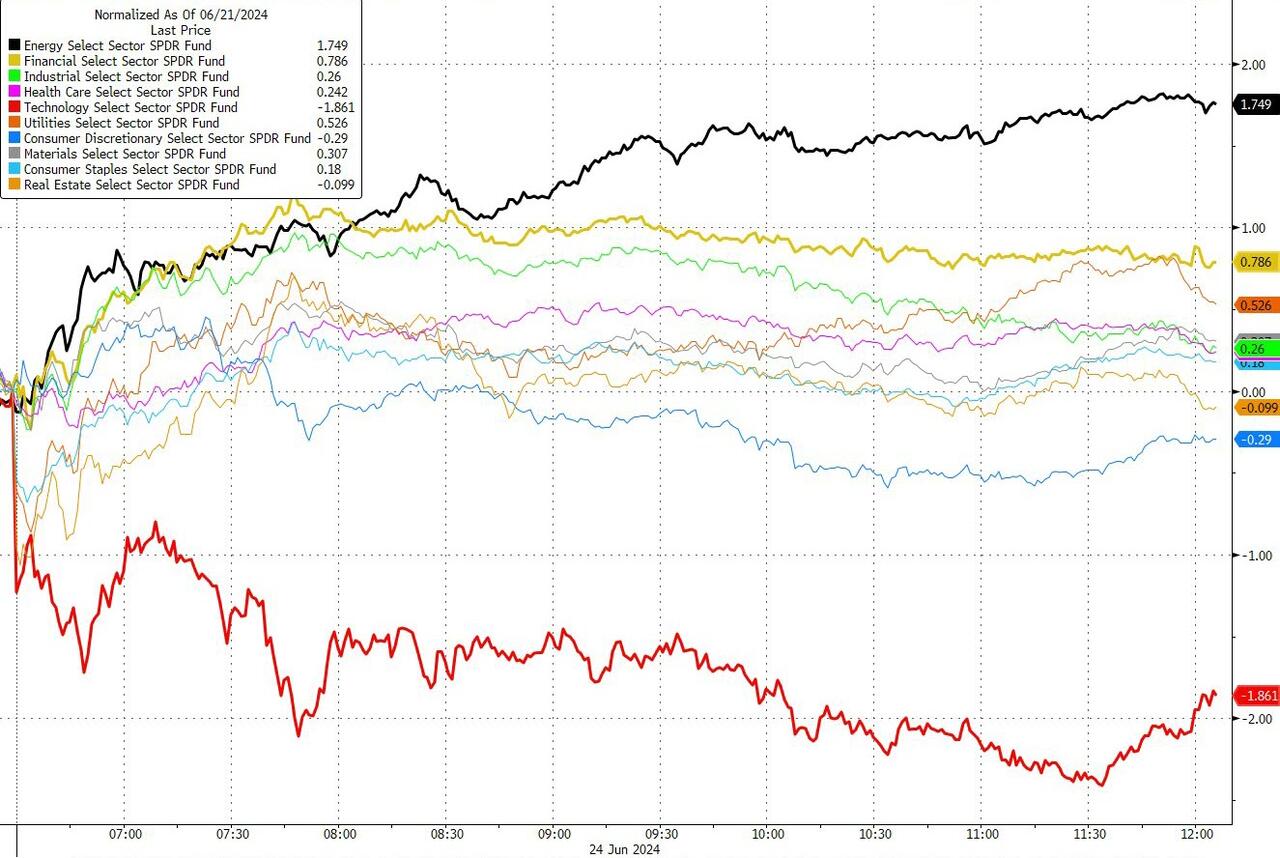
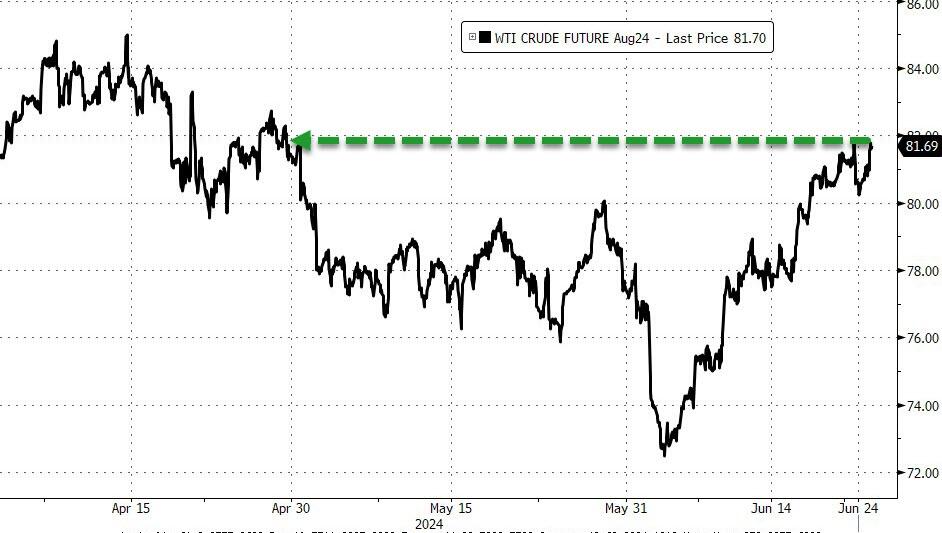
The Nasdaq was lagging as today’s session got underway with traders rotating out of the overbought tech sector and into financials, utilities, and energy, with oil climbing above the $81 level. Only the Dow managed a green close.
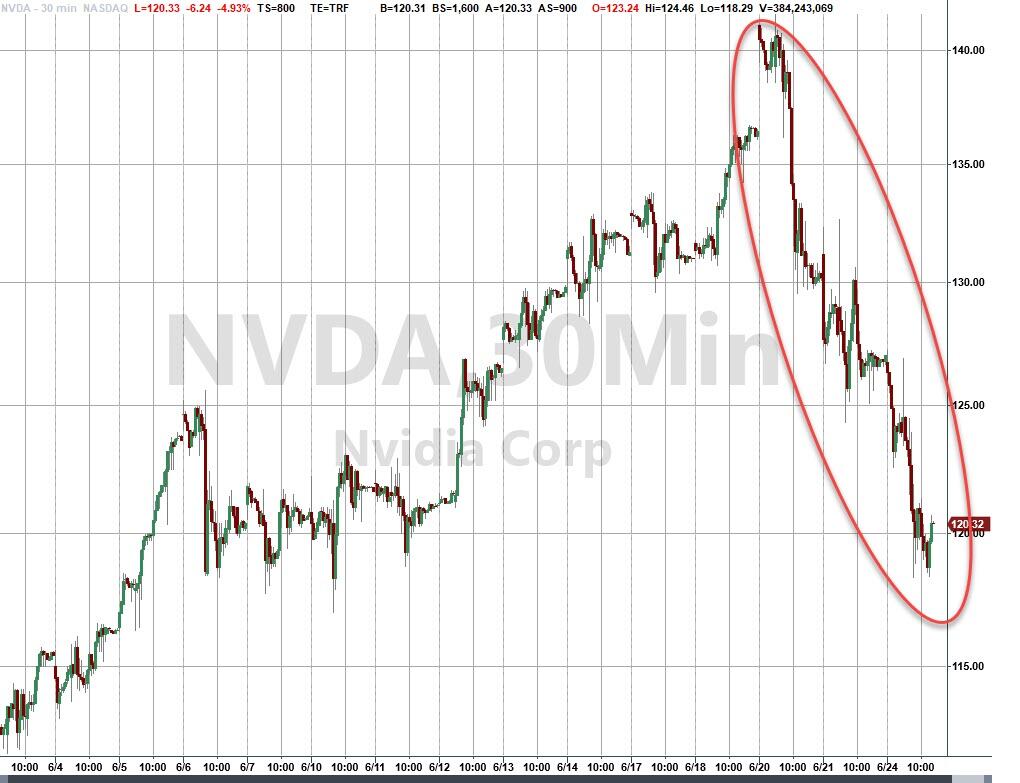
Nvidia dropped some 5% on top of last week’s 4% decline, after the stock snapped an eight-week winning streak. Analysts are interpreting its chart pattern as bearish but still are considering this pullback as “healthy” and possibly as a dip buying opportunity.
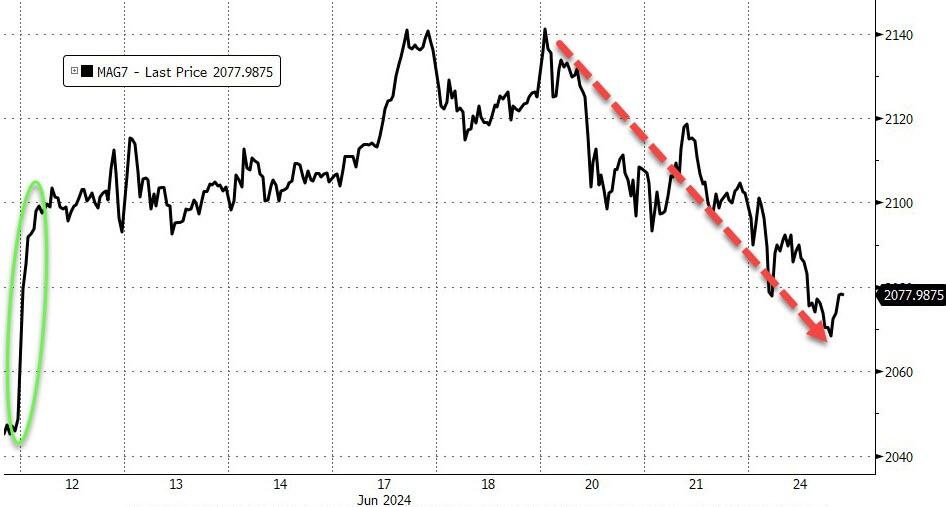
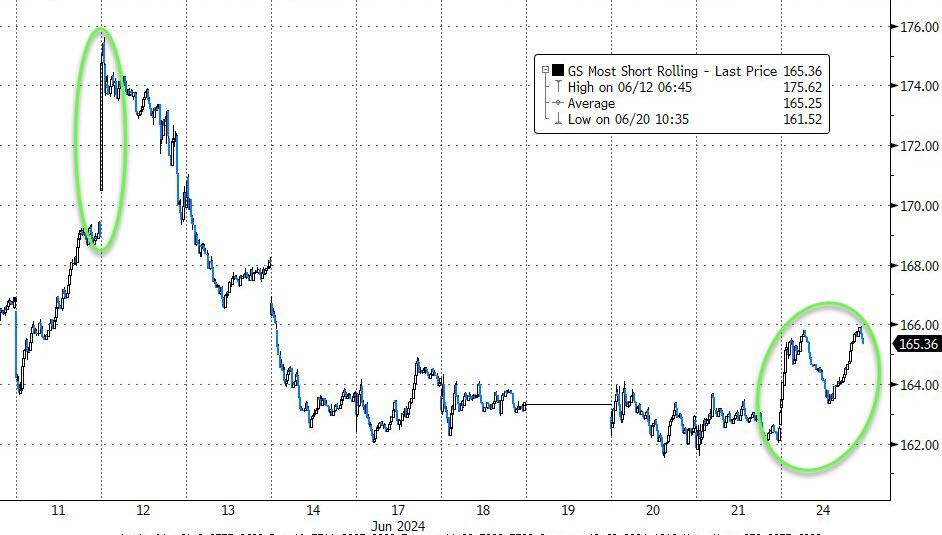
The MAG 7 stocks got dragged down as well, the most shorted stocks were squeezed, while Small Caps and the Dow outperformed.
Shifting expectations for rate cuts and a slowing economy have created a picture of concerns, but reckless enthusiasm about the development in the Artificial Intelligence arena has been the driver for a select group of equities and their indexes, while the broad market has struggled.
This week’s upcoming key inflation data, namely the Fed preferred PCE (Personal Consumption Expenditure index) will be closely analyzed to see if its reading can pursue the
Fed to finally please the markets by easing up on their hawkish policy.
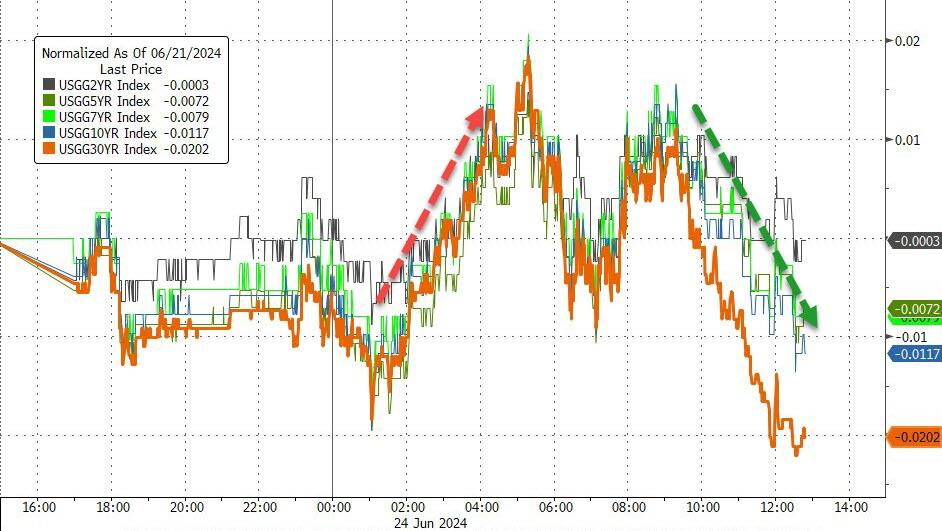
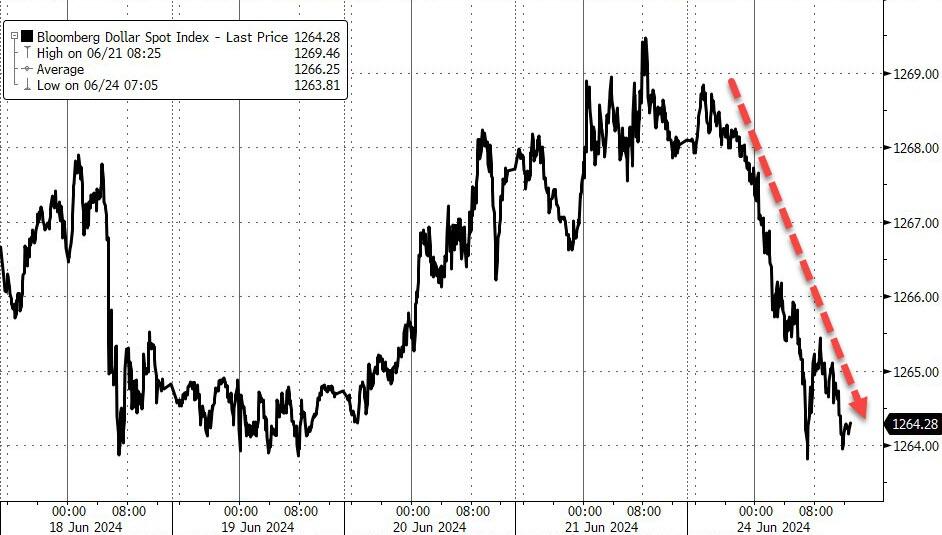
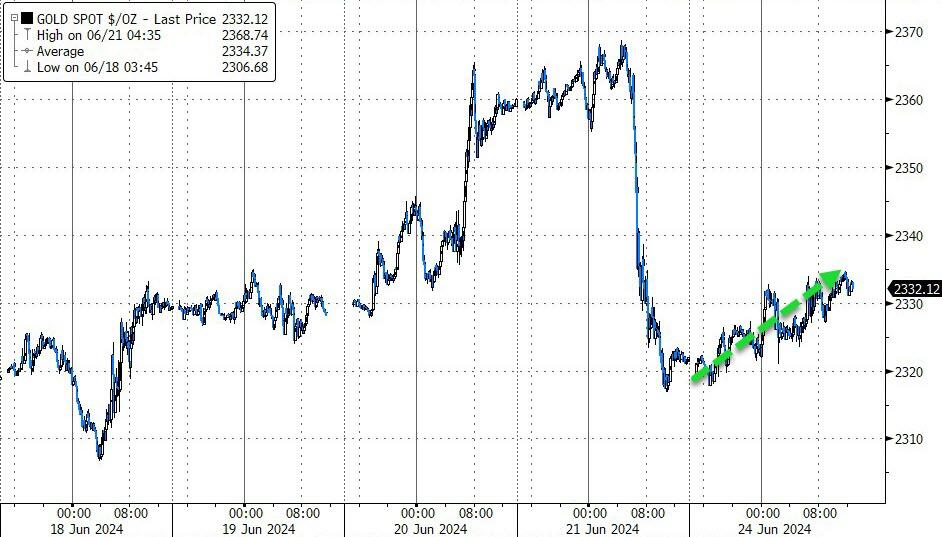
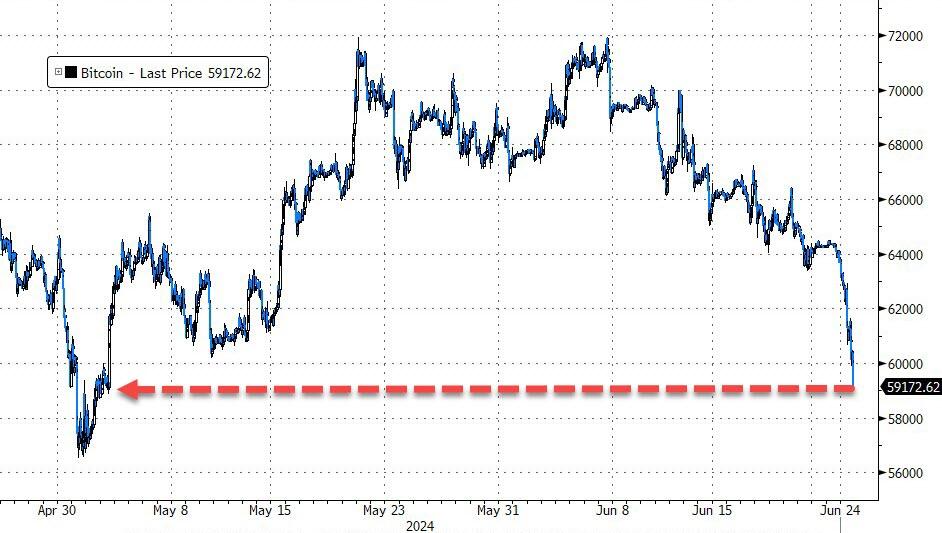
Bond yields slipped a tad, the dollar corrected sharply, but gold showed some strength after the recent sell off, as did crude oil, which headed towards its April highs. Bitcoin got spanked, as a variety of rumors took down bullish sentiment with the price dropping to its lowest since early May.
Some 80% of the S&P 500 has now entered the buyback blackout window, as ZH pointed out. Does that mean that some of the reckless bullish enthusiasm will finally meet reality?
Only time will tell.
2. Current “Buy” Cycles (effective 11/21/2023)
Our Trend Tracking Indexes (TTIs) have both crossed their trend lines with enough strength to trigger new “Buy” signals. That means, Tuesday, 11/21/2023, was the official date for these signals.
If you want to follow our strategy, you should first decide how much you want to invest based on your risk tolerance (percentage of allocation). Then, you should check my Thursday StatSheet and Saturday’s “ETFs on the Cutline” report for suitable ETFs to buy.
3. Trend Tracking Indexes (TTIs)
An early rally in the Dow and the S&P 500 ran into resistance for the latter, which closed in negative territory joined by the Nasdaq.
Our TTIs bucked the trend and ended the session in the green.
This is how we closed 06/24/2024:
Domestic TTI: +6.22% above its M/A (prior close +6.14%)—Buy signal effective 11/21/2023.
International TTI: +7.09% above its M/A (prior close +6.47%)—Buy signal effective 11/21/2023.
All linked charts above are courtesy of Bloomberg via ZeroHedge.
———————————————————-
WOULD YOU LIKE TO HAVE YOUR INVESTMENTS PROFESSIONALLY MANAGED?
Do you have the time to follow our investment plans yourself? If you are a busy professional who would like to have his portfolio managed using our methodology, please contact me directly to get more details.
Contact Ulli