
- Moving the markets
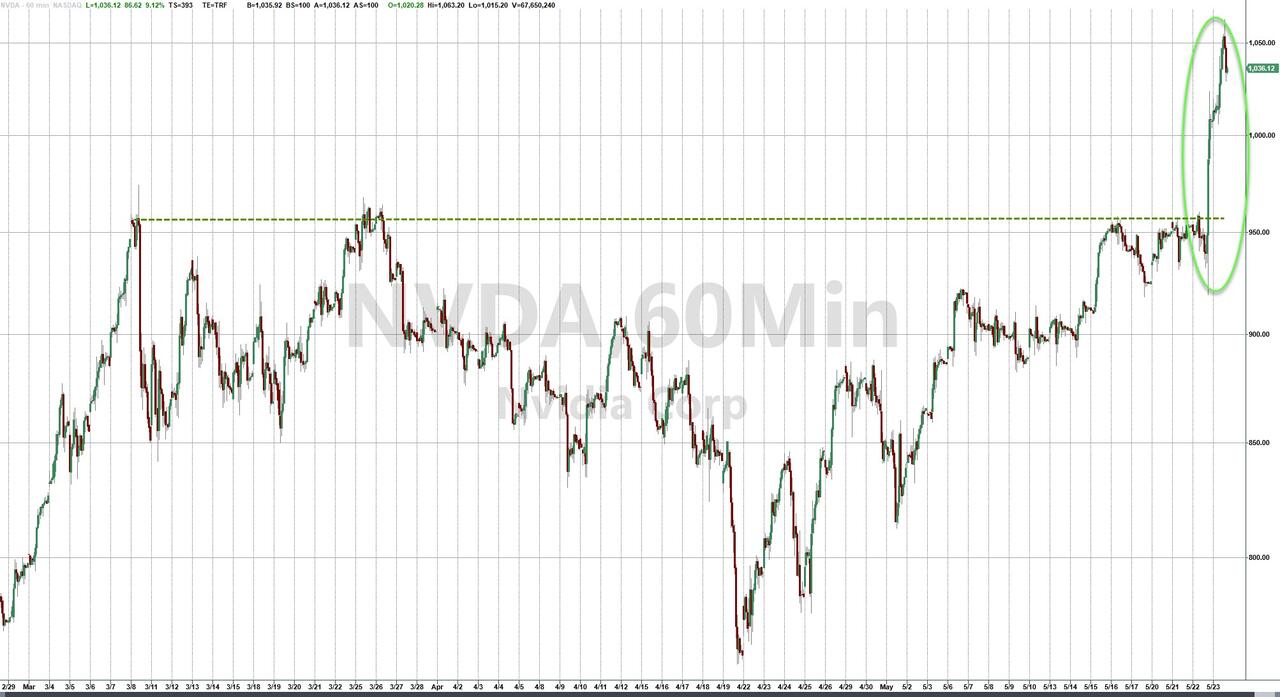
The Nasdaq jumped to a new record early on, as traders dug into the latest quarterly results from tech darling Nvidia, which smashed expectations, as its momentum does not seem to slow. Consequently, the stock surged over 10% sending it shares above $1,000.
AI is the latest theme, and companies are spending on this technology with Nvidia supplying the infrastructure on the future downstream economy. The excitement about this sector is not waning, and the future looks positive for this part of the economy.
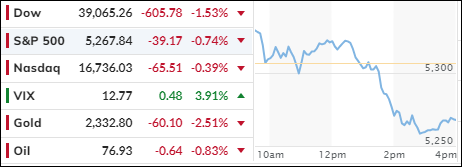
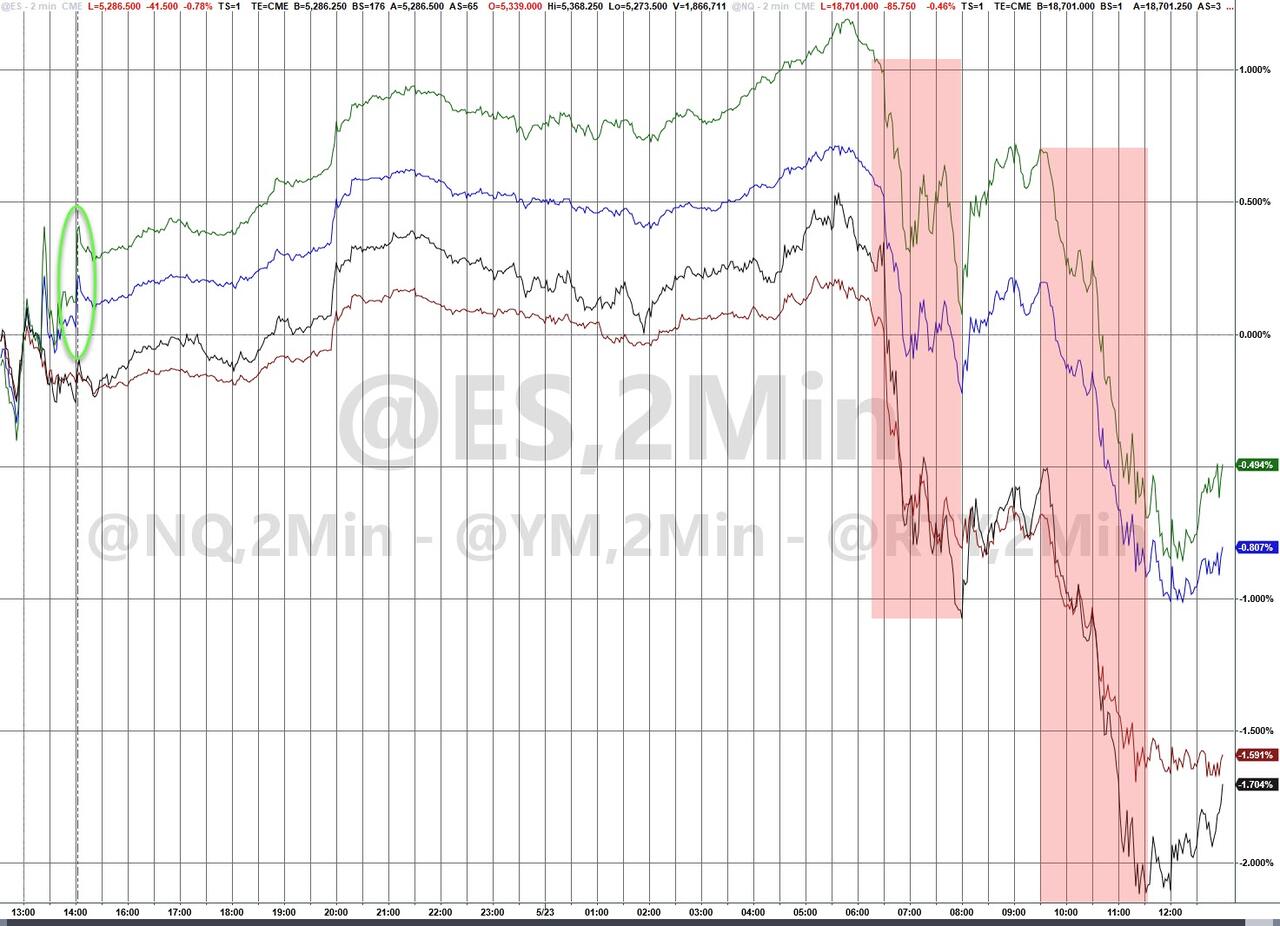
While traders had hoped that Nvidia’s blow-out earnings report would be a moment of truth and lift all markets, that did not happen, as the adage “buy the rumor, sell the fact” pulled the broad indexes lower. The markets plunged, with the Dow faring the worst, puking 600 some points. So much for all the hype.
Keeping underlying bullish hopes at bay were comments from JPMorgan’s CEO, Jamie Dimon, who sang from my hymn sheet by saying that “the worst outcome for the U.S. economy will be a ‘stagflation’ scenario, where inflation continues to rise, but growth slows amid high unemployment.”
He also added that interest rates could still go up “a little bit.”
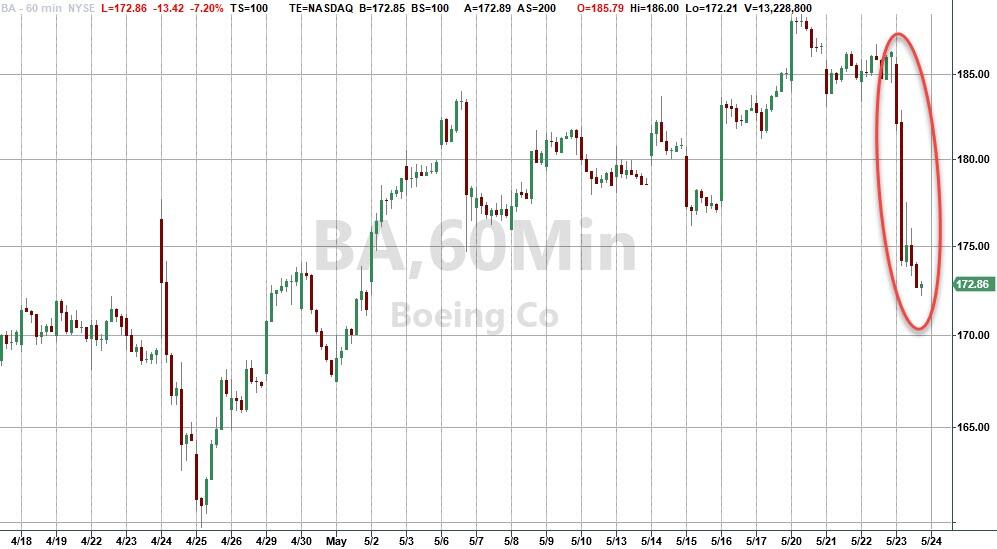
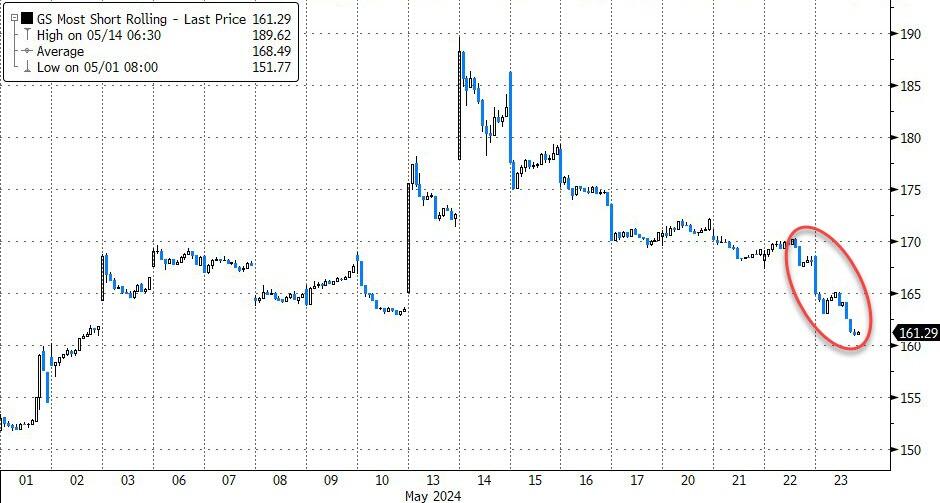
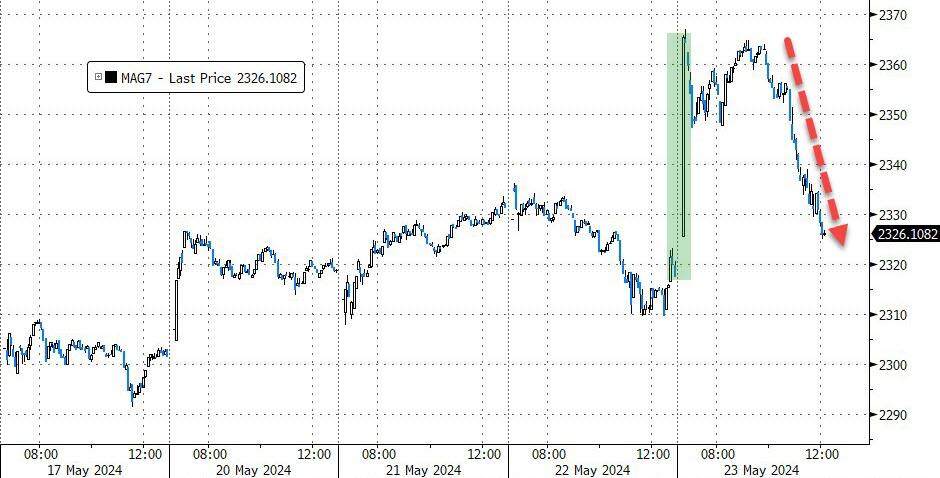
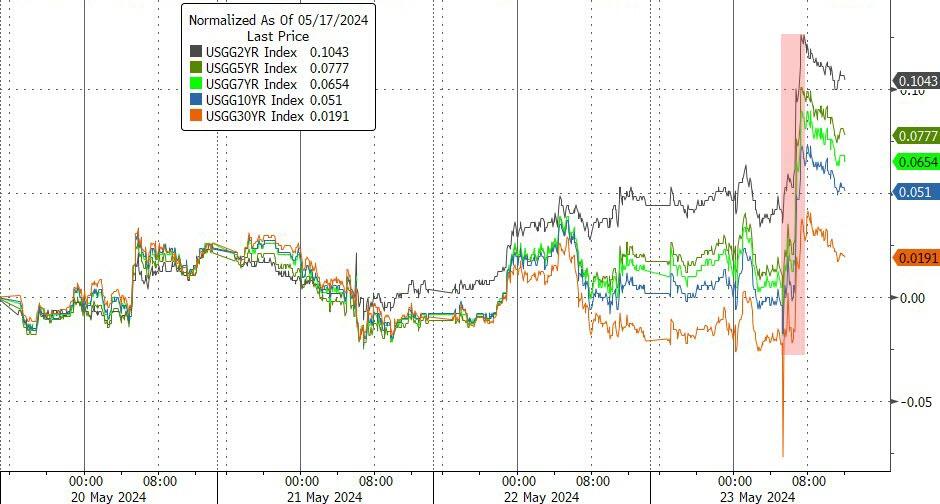
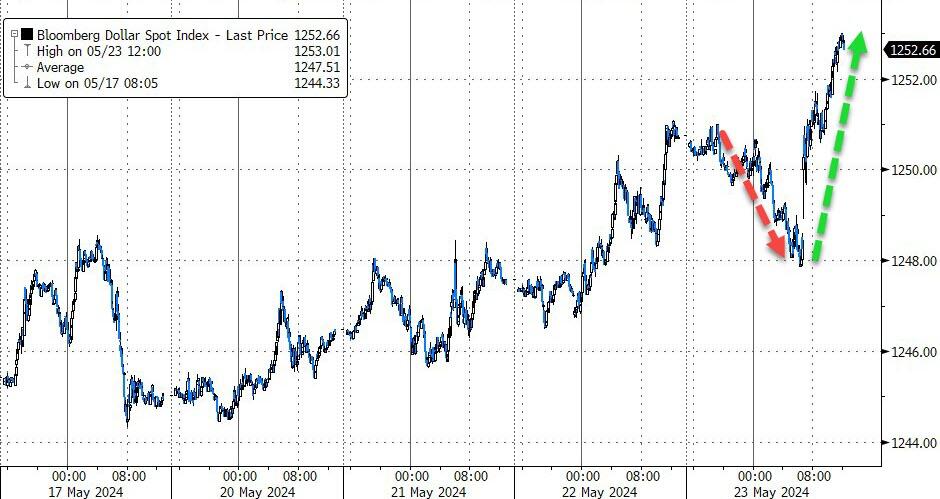
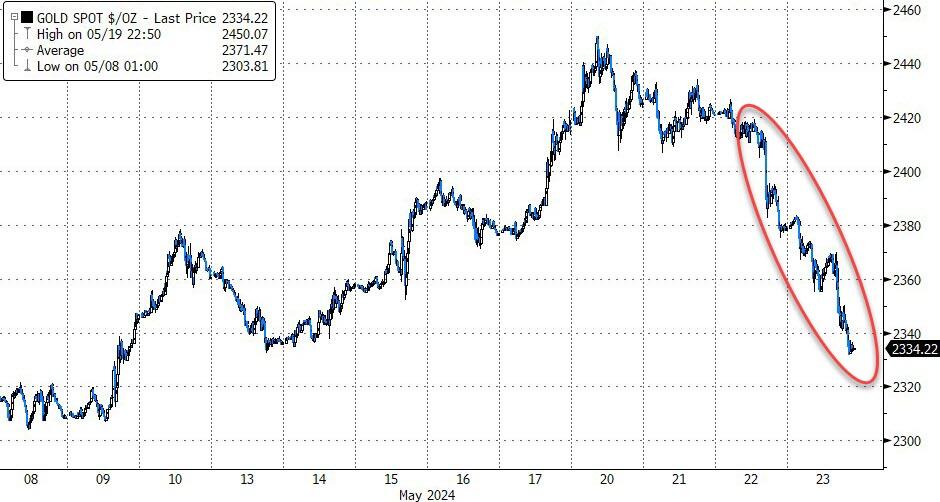
Boeing got hit hard, the short squeeze ran out of ammo, and the MAG7 stocks gave back most of their early “rip.” Bond yields were higher across all maturities, which catapulted the dollar higher but slammed gold again.
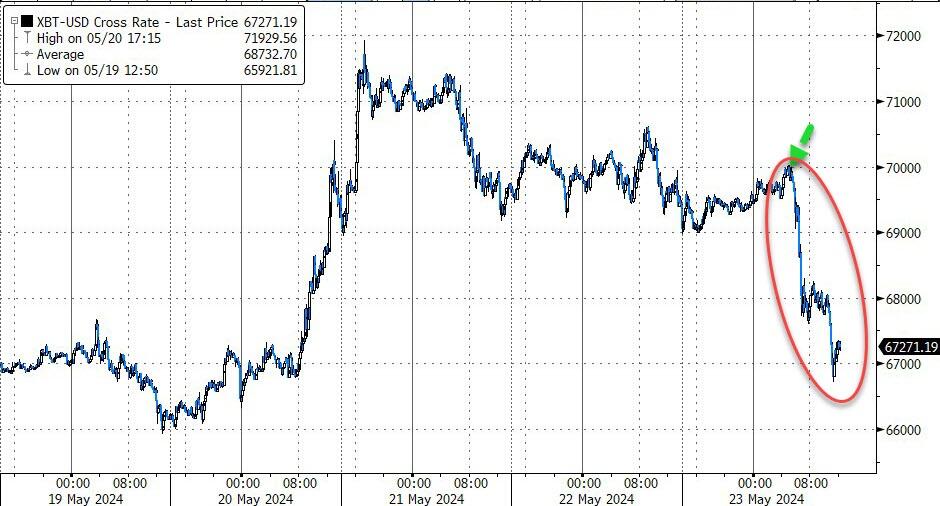
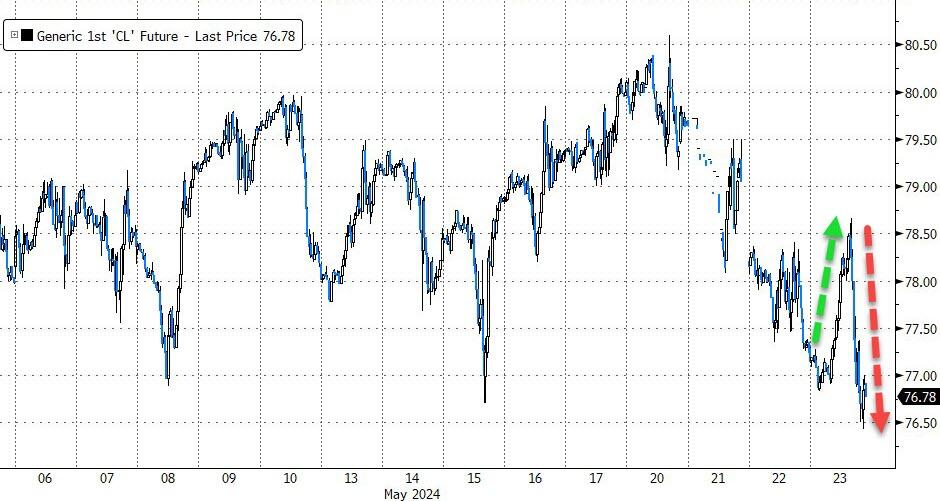
Bitcoin touched its $70k level and was abandoned. Oil prices rode the roller coaster but only closed lower by a moderate margin.
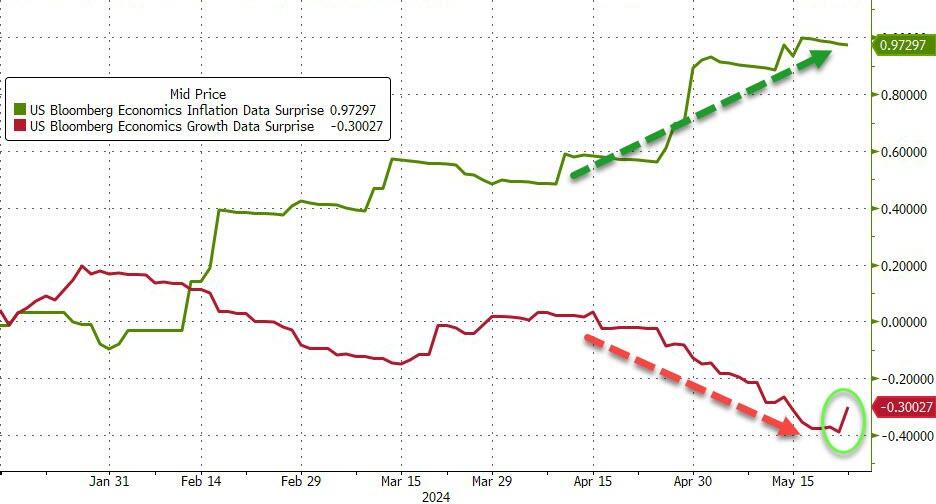
Looking at the big picture, it’s clear that we are stuck in a stagflation environment, which will likely not motivate the Fed into cutting rates.
2. Current “Buy” Cycles (effective 11/21/2023)
Our Trend Tracking Indexes (TTIs) have both crossed their trend lines with enough strength to trigger new “Buy” signals. That means, Tuesday, 11/21/2023, was the official date for these signals.
If you want to follow our strategy, you should first decide how much you want to invest based on your risk tolerance (percentage of allocation). Then, you should check my Thursday StatSheet and Saturday’s “ETFs on the Cutline” report for suitable ETFs to buy.
3. Trend Tracking Indexes (TTIs)
An early exuberant rally, based on Nvidia’s better-than-expected earnings, ran into overhead resistance, which pulled all indexes off their lofty levels and sent them plunging into the red. The Dow was spanked the worst with the index losing some 600 points.
Our TTIs followed suit but remain solidly above their trend lines, indicating a continued bullish picture.
This is how we closed 5/23/2024:
Domestic TTI: +7.40% above its M/A (prior close +8.93%)—Buy signal effective 11/21/2023.
International TTI: +9.14% above its M/A (prior close +9.89%)—Buy signal effective 11/21/2023.
All linked charts above are courtesy of Bloomberg via ZeroHedge.
———————————————————-
WOULD YOU LIKE TO HAVE YOUR INVESTMENTS PROFESSIONALLY MANAGED?
Do you have the time to follow our investment plans yourself? If you are a busy professional who would like to have his portfolio managed using our methodology, please contact me directly to get more details.
—————————————————————-
Contact Ulli