
ETF Tracker StatSheet
You can view the latest version here.
NASDAQ LEADS MARKET REBOUND AS TECH STOCKS RALLY DESPITE RATE CUT HOPES DIMMING
- Moving the markets
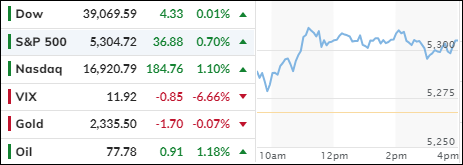
The major indexes inched higher trying to recover from yesterday’s drubbing, the worst since March 2023. The Nasdaq led the rebound, and the Dow lagged.
Despite hopes being dashed that the Fed may cut rates this summer, enthusiasm for Nvidia and other tech companies lifted the major indexes with the Nasdaq sprinting ahead by over 1%.
The latest earnings reports were mixed with Workday falling more than 10%, while Intuit surrendered over 8% due to weak guidance. Deckers Outdoor bucked the trend with an 11% surge.
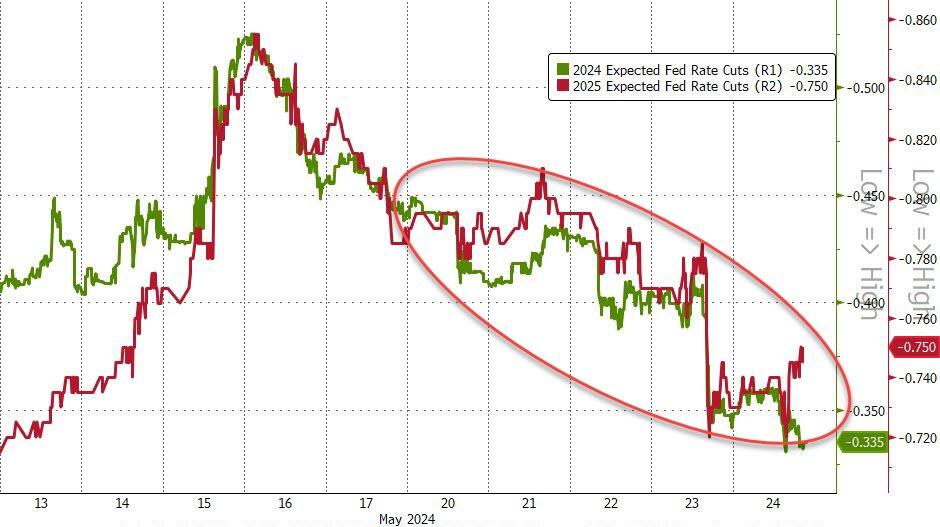
On the economic side, demand for Durable Goods surprised to the upside, as orders for long-lasting items like appliances, cars and airplanes rose 0.7% for the month, which was better than the consensus estimate for a 1% drop. Despite new orders being flat, these robust data points diminished traders’ hopes for a rate cut.
Services and Manufacturing data also surpassed forecasts from economists, while weekly jobless claims signaled the weakness in the labor market may have halted. Again, none of these numbers will affect the Fed’s current position of “higher for longer.”
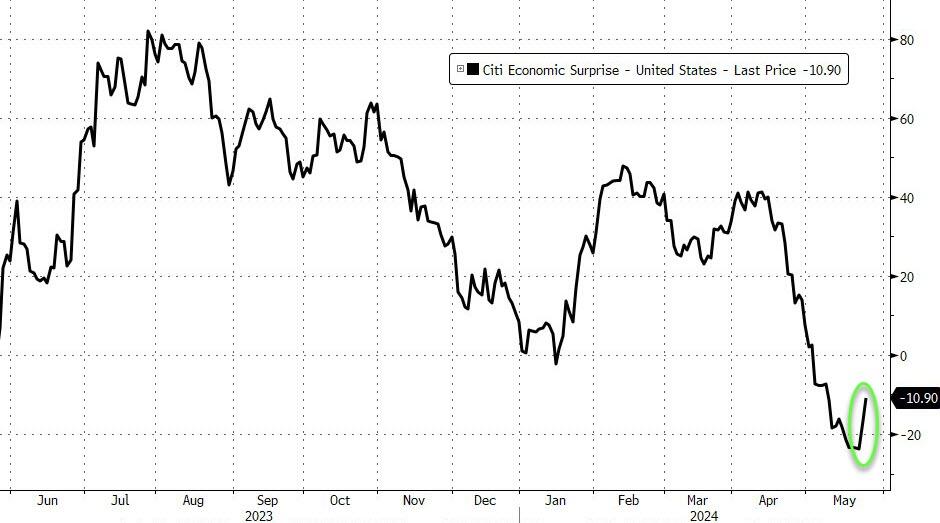
As ZH pointed out, after six straight weeks of ‘weakness’, US Macro Surprise data surged higher this week (good news) — it’s biggest positive weekly shift since January. To no surprise, this sent rate cut expectations tumbling.
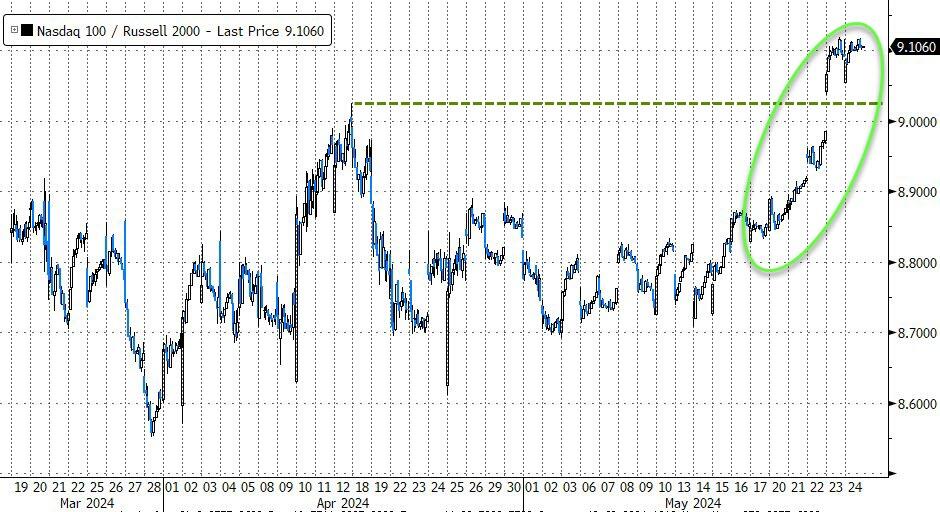
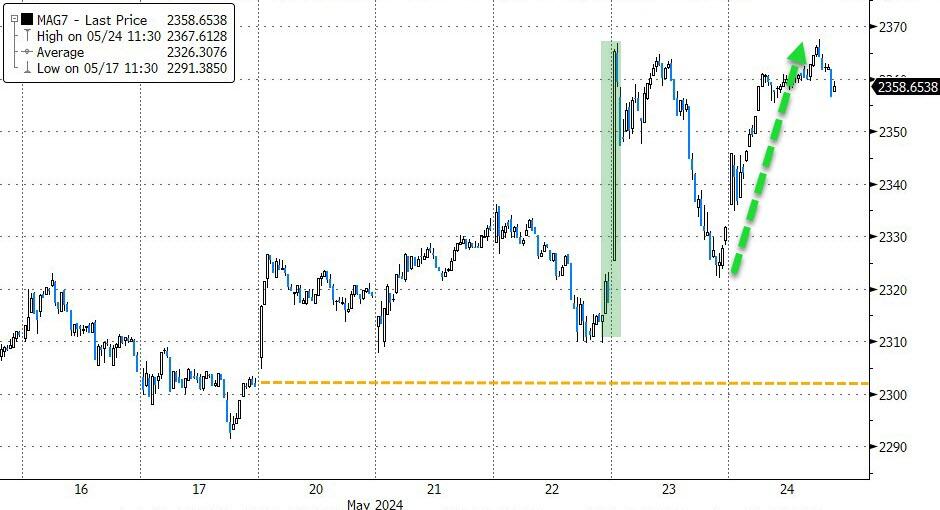
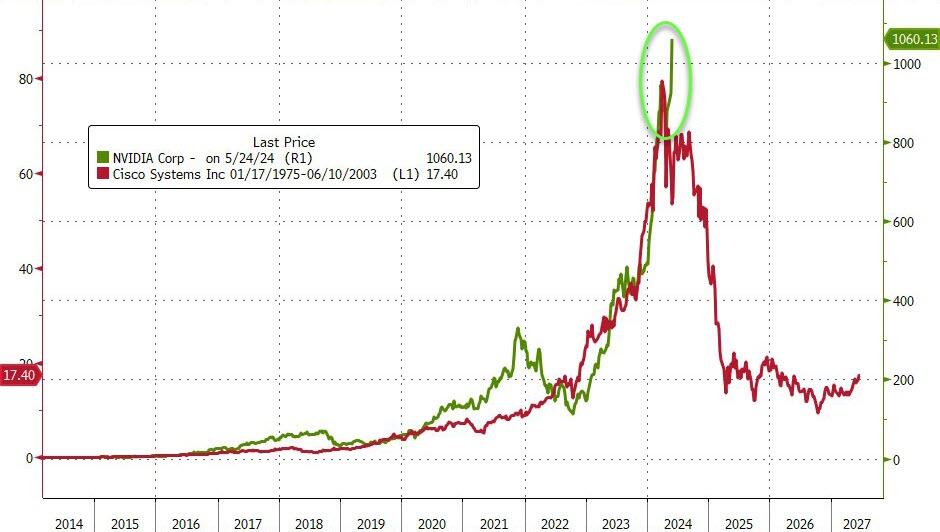
The MAG7 stocks recovered from yesterday’s sell off and rallied for the fifth straight week to a new record high, thereby surpassing the comparison to Cisco’s historical performance.
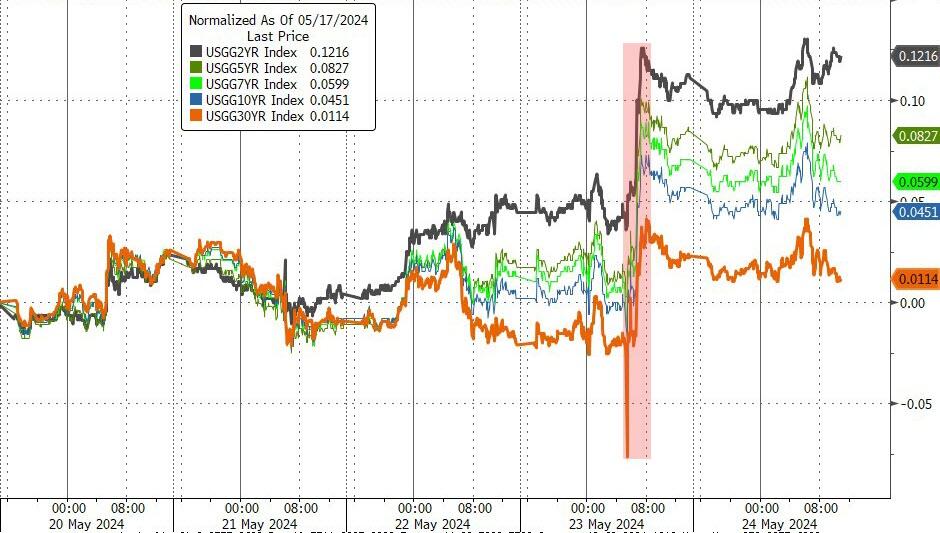
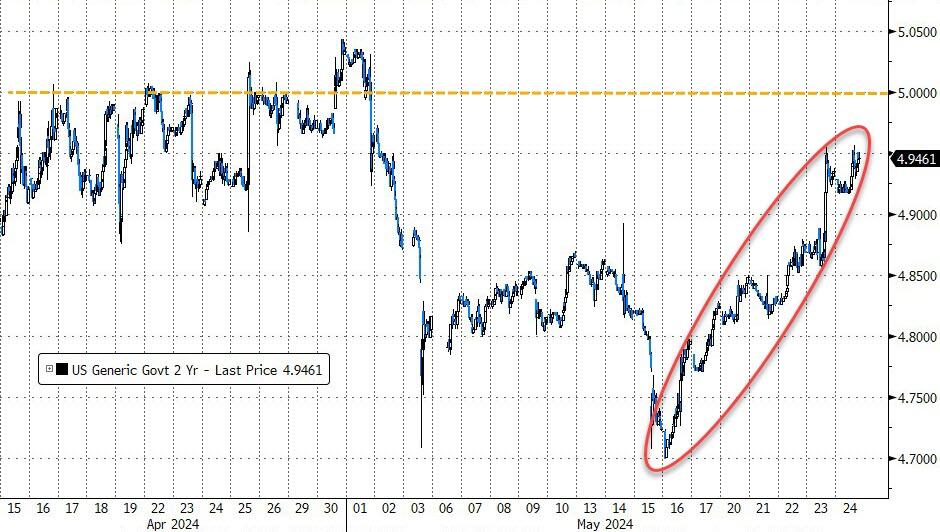
Bond yields climbed to end the week higher, with the 2-year storming towards its 5% level. That was its biggest weekly yield increase in almost 2 months.
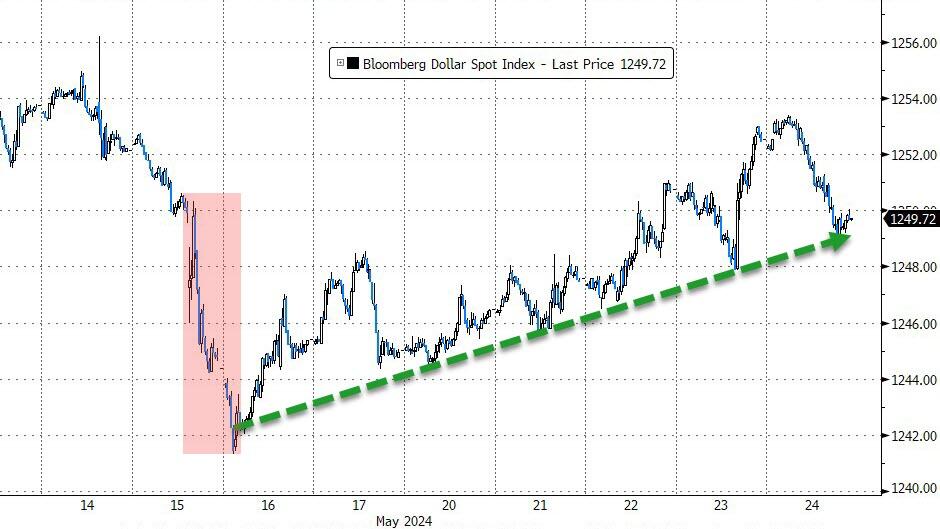
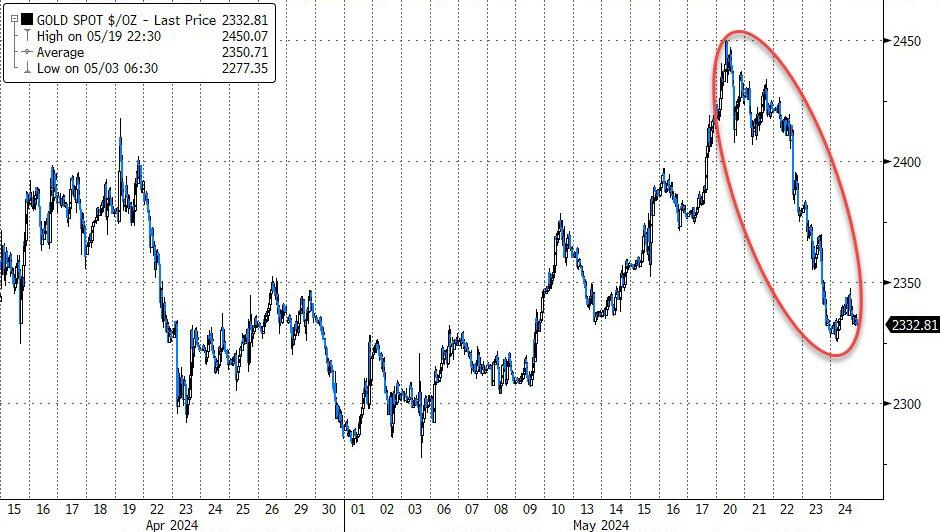
The dollar rode the roller coaster but ended higher after last week’s losses. That pulled gold off its lofty level, but the precious metal easily defended its $2k marker.
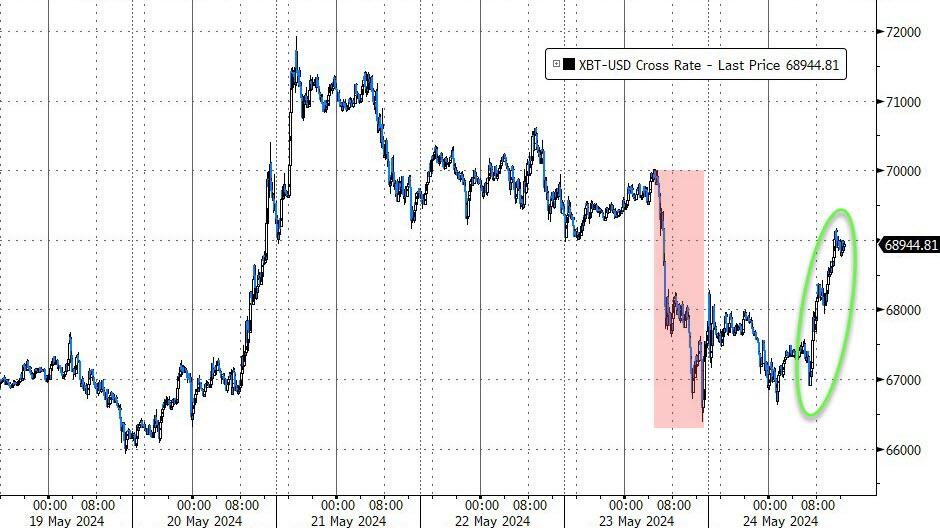
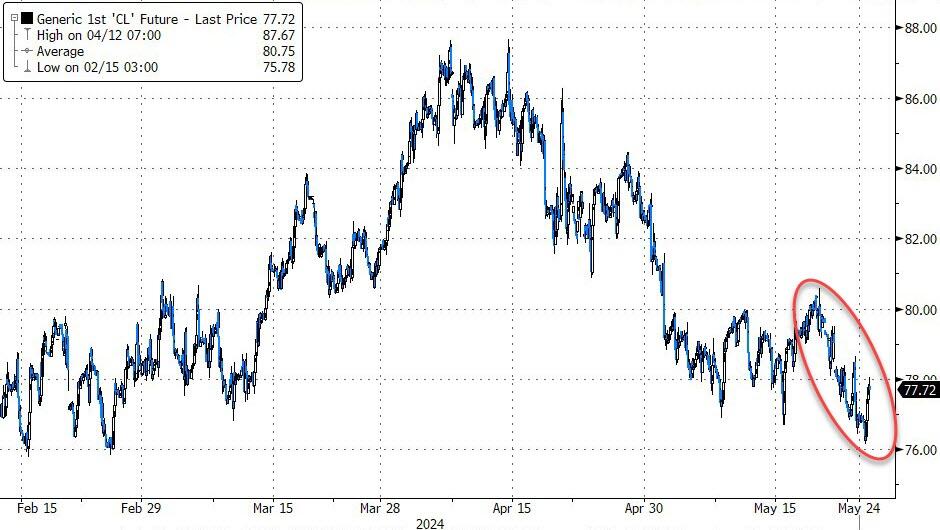
Bitcoin recovered from yesterday’s drop and bounced back to $69k, as oil prices ended lower on the week and losing its $78 support zone.
A tip of the hat goes to ZH for pointing out another decoupling, namely between US Reserve balances and Market Capitalization. It’s another alligator snout that eventually will snap shut.
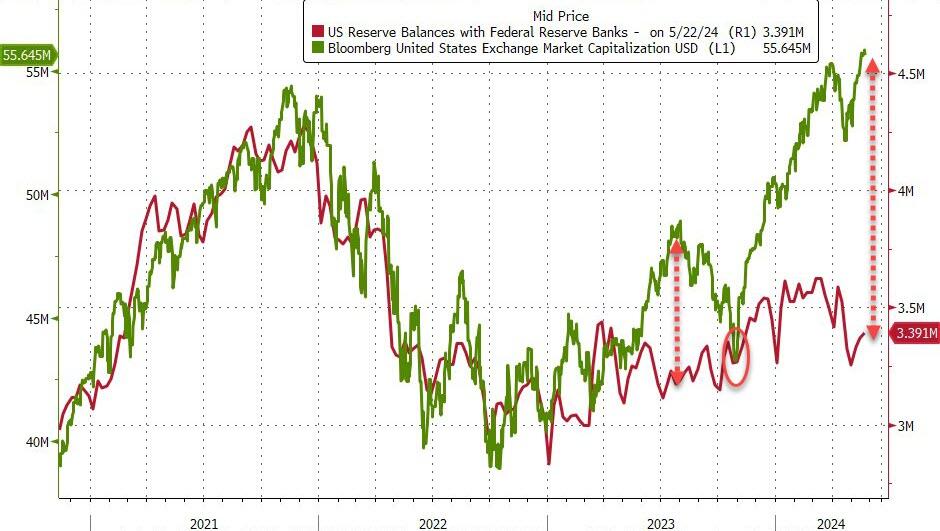
If history is any indication, market capitalization will take a hit—and that would mean lower equity prices.
2. Current “Buy” Cycles (effective 11/21/2023)
Our Trend Tracking Indexes (TTIs) have both crossed their trend lines with enough strength to trigger new “Buy” signals. That means, Tuesday, 11/21/2023, was the official date for these signals.
If you want to follow our strategy, you should first decide how much you want to invest based on your risk tolerance (percentage of allocation). Then, you should check my Thursday StatSheet and Saturday’s “ETFs on the Cutline” report for suitable ETFs to buy.
3. Trend Tracking Indexes (TTIs)
After yesterday’s drubbing of the markets, it came as no surprise that the indexes staged a comeback and recouped some of their losses.
Our TTIs joined the rebound and headed moderately higher, with the Domestic one taking the lead.
This is how we closed 5/24/2024:
Domestic TTI: +7.74% above its M/A (prior close +7.40%)—Buy signal effective 11/21/2023.
International TTI: +8.98% above its M/A (prior close +9.14%)—Buy signal effective 11/21/2023.
All linked charts above are courtesy of Bloomberg via ZeroHedge.
———————————————————-
WOULD YOU LIKE TO HAVE YOUR INVESTMENTS PROFESSIONALLY MANAGED?
Do you have the time to follow our investment plans yourself? If you are a busy professional who would like to have his portfolio managed using our methodology, please contact me directly to get more details.
—————————————————————-
Contact Ulli