
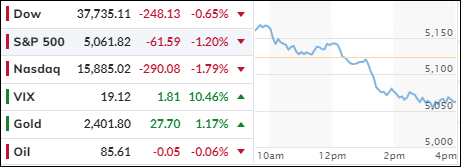
[Chart courtesy of MarketWatch.com]
- Moving the markets
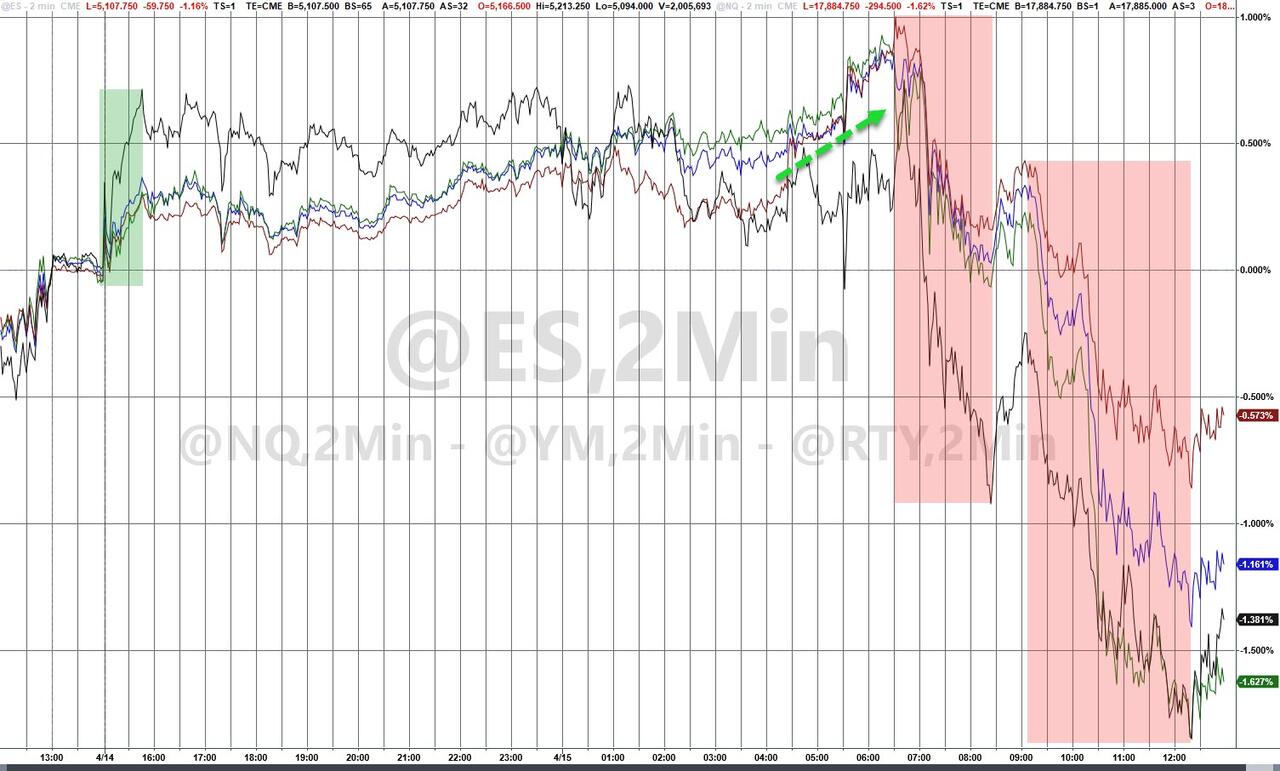
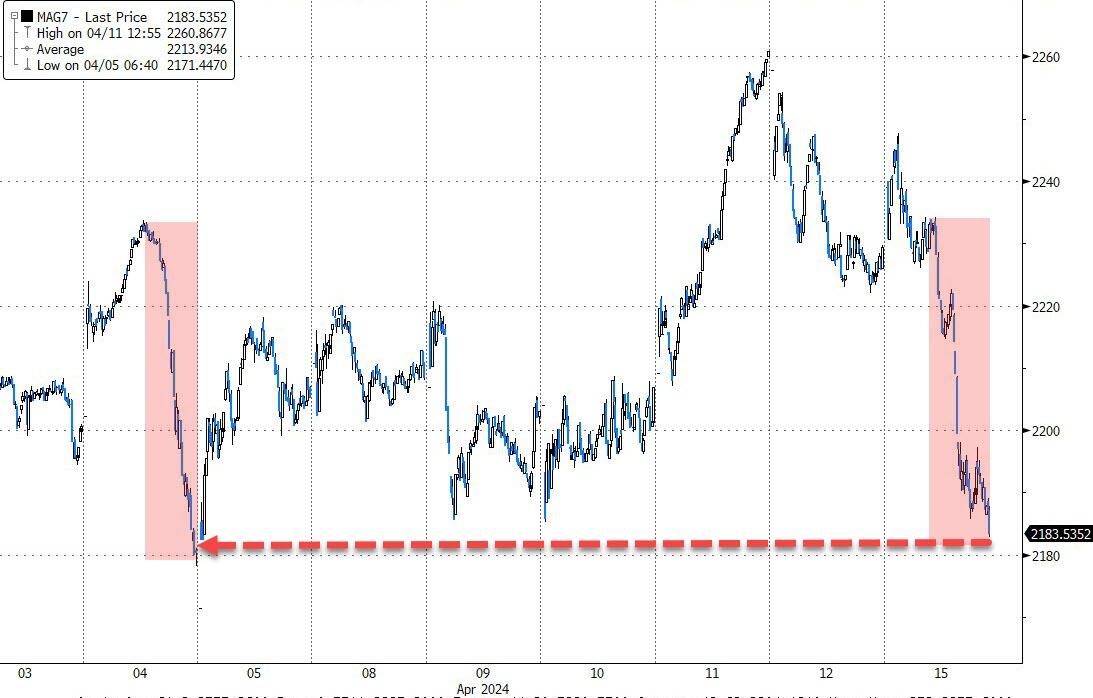
Despite a promising start with strong earnings from Goldman Sachs and encouraging retail data, the major indexes took a downturn, erasing the gains from the morning rally. The conflict in the Middle East remains a concern, but there is hope it won’t escalate further. Small Caps and the Mag7 stocks experienced a significant drop, reminiscent of the downturn two weeks prior.
On Wall Street, a surge in retail sales by 0.7% in March—exceeding the expected 0.3%—signaled continued consumer strength despite the pressures of inflation. Yet, this positive economic indicator did not prevent the S&P 500 from slipping 1.2%, a stark contrast to its earlier 0.9% rise. The Nasdaq Composite fell even more, by 1.7%, with Salesforce and other tech stocks facing the brunt of the impact.
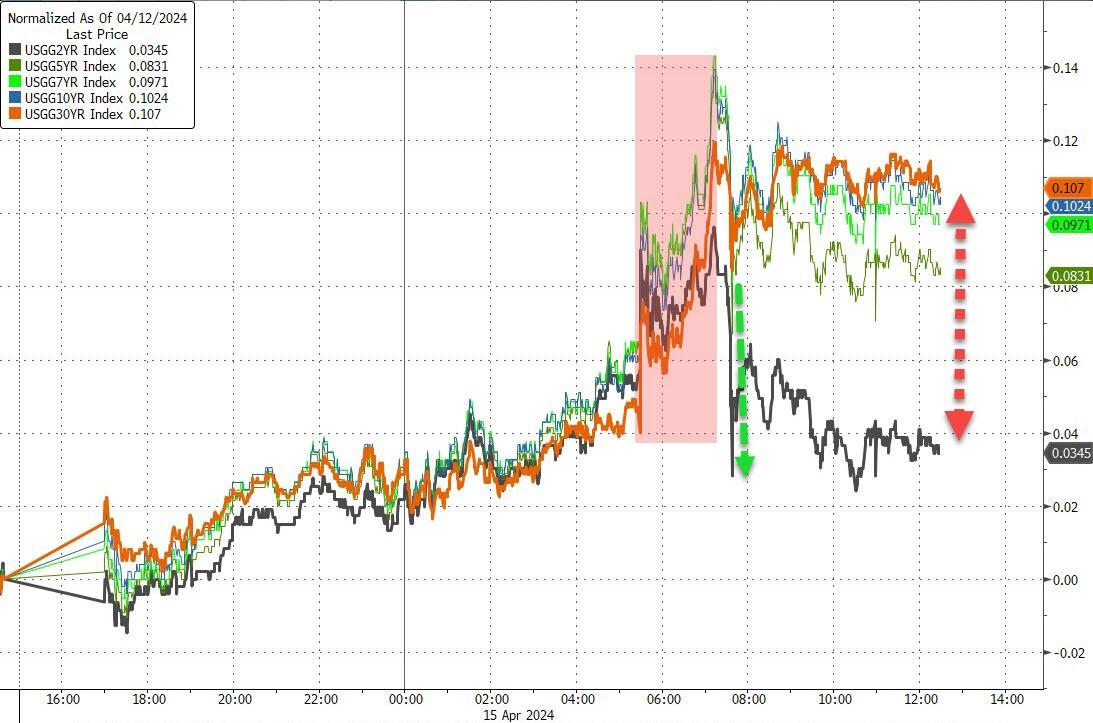
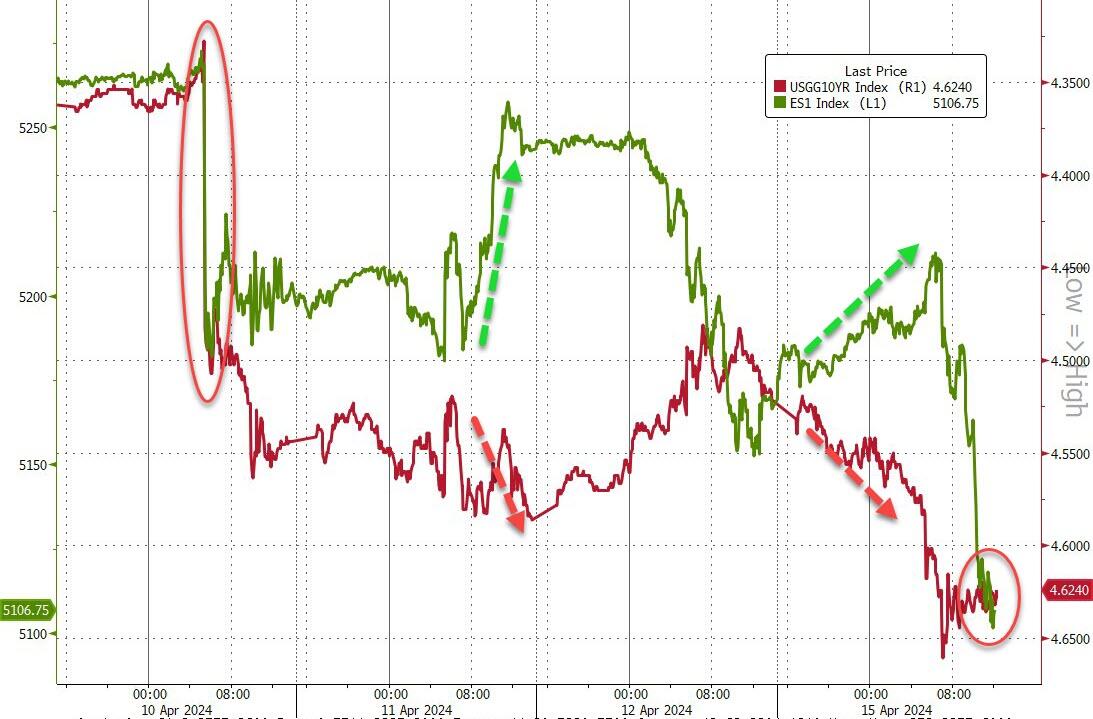
Interest rates rose, dampening the market’s initial optimism. The 10-year Treasury yield climbed past the pivotal 4.6% mark, reaching its highest point since mid-November. This increase came on the heels of the robust retail sales data.
Gold experienced a rollercoaster, initially dropping over 1% to $2,346.00 an ounce, then rebounding with a 1.1% surge, breaking past the $2,400 threshold for the first time. This volatility follows gold’s record high last week, with an around 15% increase this year as investors flocked to the metal amidst persistent inflation and geopolitical unrest.
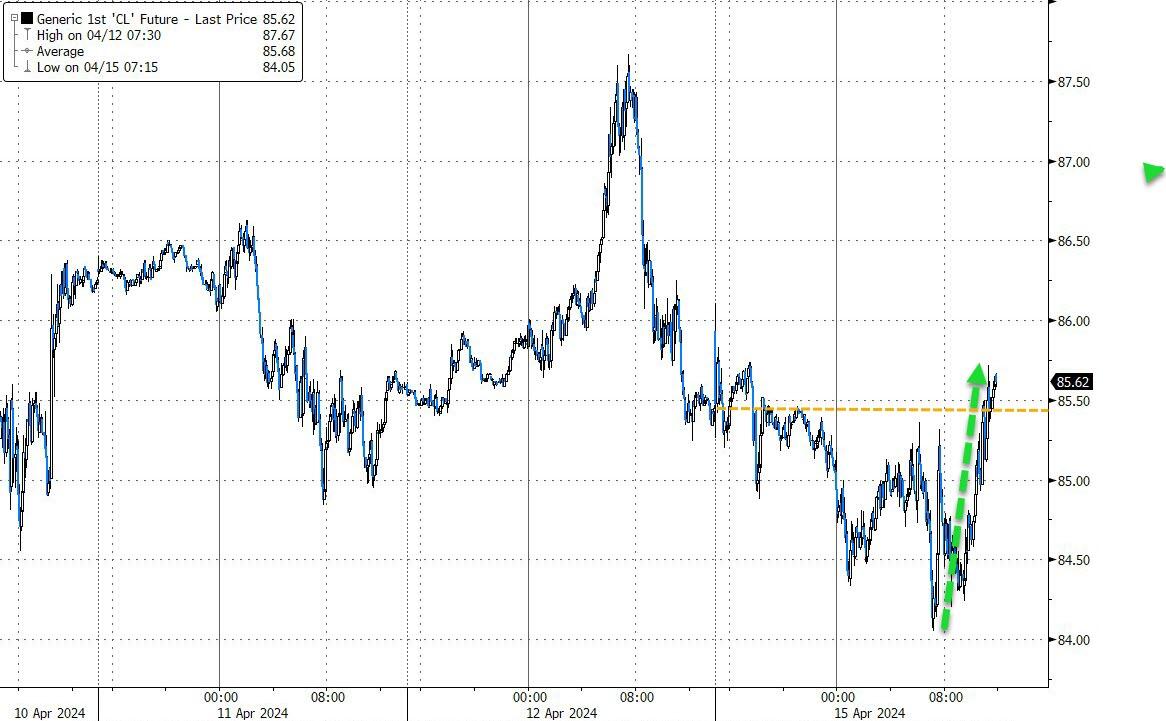
Oil prices saw a slight decline, relinquishing earlier gains, yet managed to recover from the day’s lows in later trading, exerting additional pressure on the market. The cumulative effect of Monday’s downturn added to the previous week’s significant losses, driven by ongoing inflation worries and a disappointing start to the corporate earnings season. Both the Dow and S&P 500 recorded their worst weekly performances since the previous year.
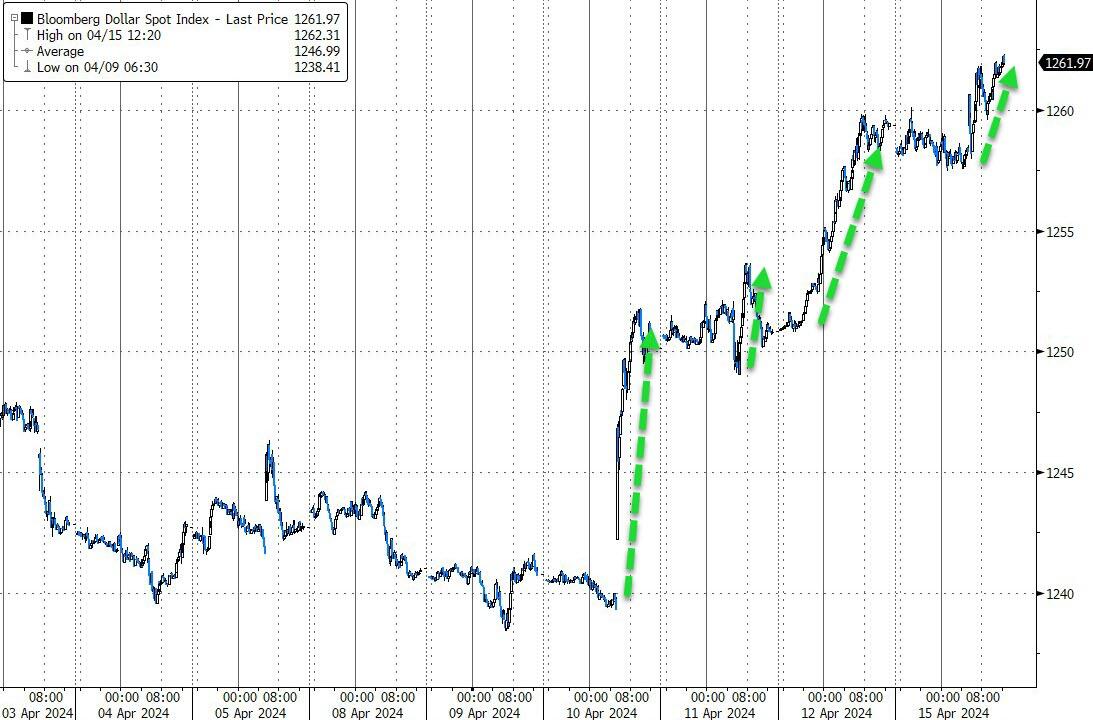
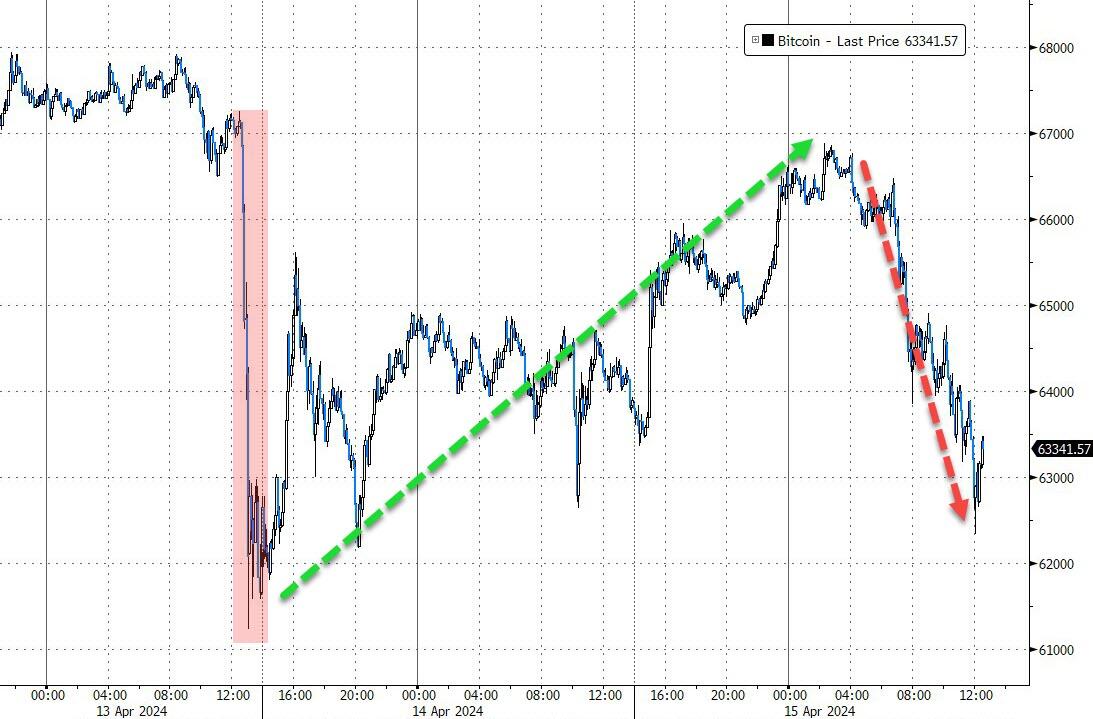
As bond yields soared and the dollar reached its highest level since November 13th, Bitcoin’s value declined, oil prices bounced back from initial losses, and gold fluctuated before closing at a new all-time high.
Ultimately, the S&P 500 adjusted downward, aligning with the reality of higher bond yields.
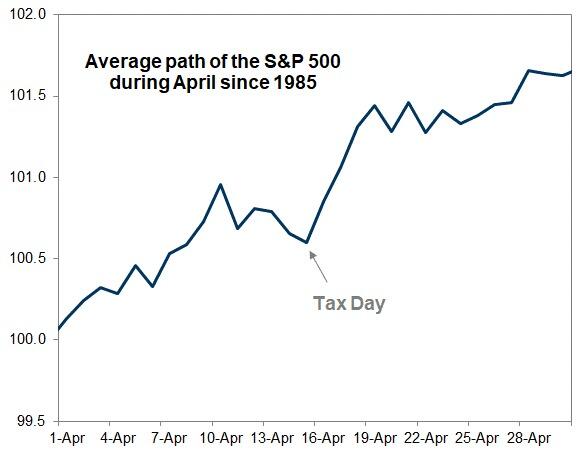
As we close out this Tax Day, could this be the turning point that marks the end of the current market correction?
2. Current “Buy” Cycles (effective 11/21/2023)
Our Trend Tracking Indexes (TTIs) have both crossed their trend lines with enough strength to trigger new “Buy” signals. That means, Tuesday, 11/21/2023, was the official date for these signals.
If you want to follow our strategy, you should first decide how much you want to invest based on your risk tolerance (percentage of allocation). Then, you should check my Thursday StatSheet and Saturday’s “ETFs on the Cutline” report for suitable ETFs to buy.
3. Trend Tracking Indexes (TTIs)
Initially, the markets opened on a positive note. However, the situation changed as the early winners (equities) became losers, and vice versa (gold and crude oil).
Our Trend Tracking Indexes (TTIs) followed the bearish trend and closed lower.
This is how we closed 4/15/2024:
Domestic TTI: +5.86% above its M/A (prior close +6.78%)—Buy signal effective 11/21/2023.
International TTI: +6.59% above its M/A (prior close +7.14%)—Buy signal effective 11/21/2023.
All linked charts above are courtesy of Bloomberg via ZeroHedge.
———————————————————-
WOULD YOU LIKE TO HAVE YOUR INVESTMENTS PROFESSIONALLY MANAGED?
Do you have the time to follow our investment plans yourself? If you are a busy professional who would like to have his portfolio managed using our methodology, please contact me directly to get more details.
—————————————————————-
Contact Ulli