
- Moving the markets
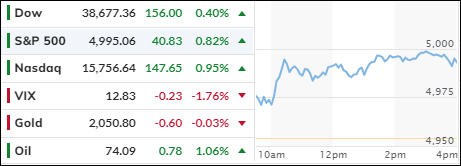
The stock market had a good day on Wednesday, as the S&P 500 got close to the 5,000 mark for the first time ever. Investors were happy with the latest earnings reports, which mostly beat the low expectations.
Big tech and AI companies did especially well, but they also hogged most of the spotlight. The problem is the economy is growing too fast for the central banks to handle. They are trying to keep inflation under control, but they don’t know when and how much to cut interest rates.
Fed chair Powell has been putting the brakes on the rate-cut hopes, making the market more volatile.
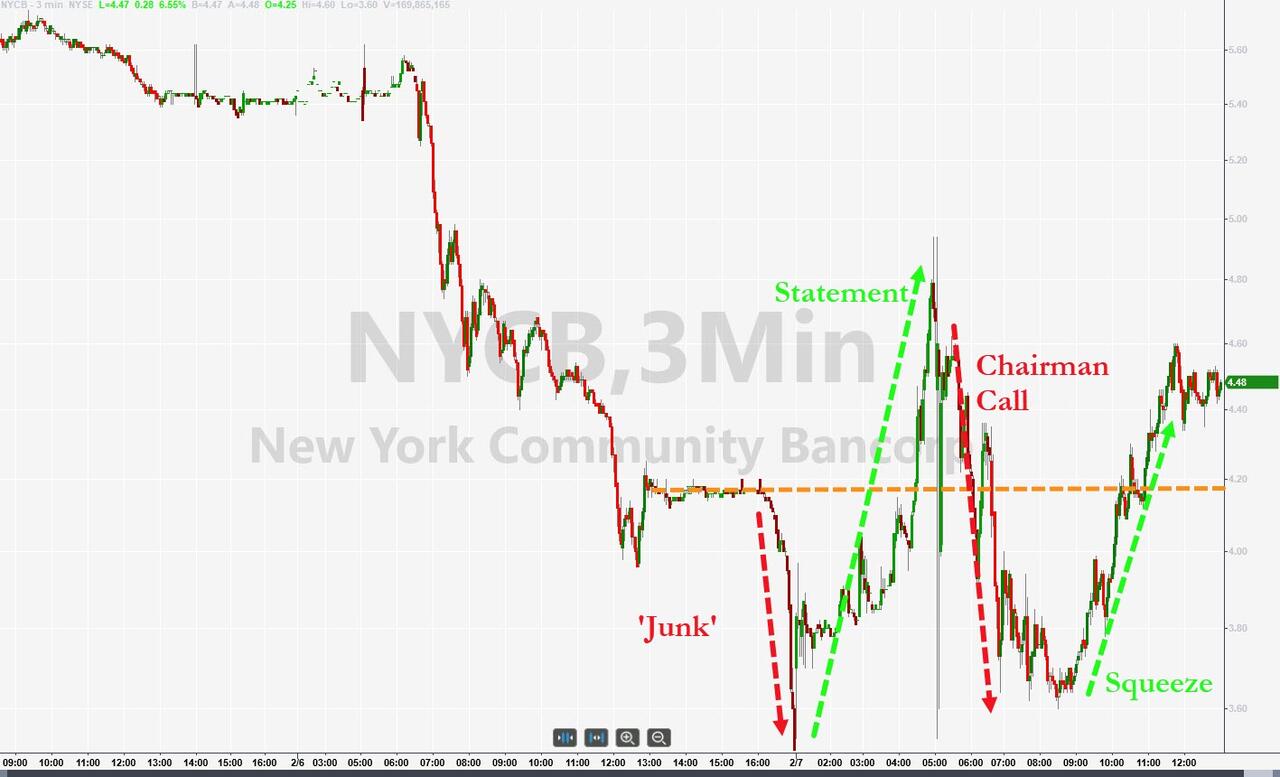
Meanwhile, the regional banks are in trouble. New York Community Bancorp tanked 11% after getting a junk rating from Moody’s. The bank lost money and cut its dividend in the fourth quarter, thanks to the falling values of commercial real estate. It was not the only one, and some fear it could trigger a new banking crisis.
The Fed speakers did not help much, as they gave mixed signals about the rate outlook. Some said they would wait and see, some said they would cut rates two or three times this year, some said they were not done with inflation yet, and some said they might raise rates later. It was a confusing chorus of voices, and the market did not buy it.
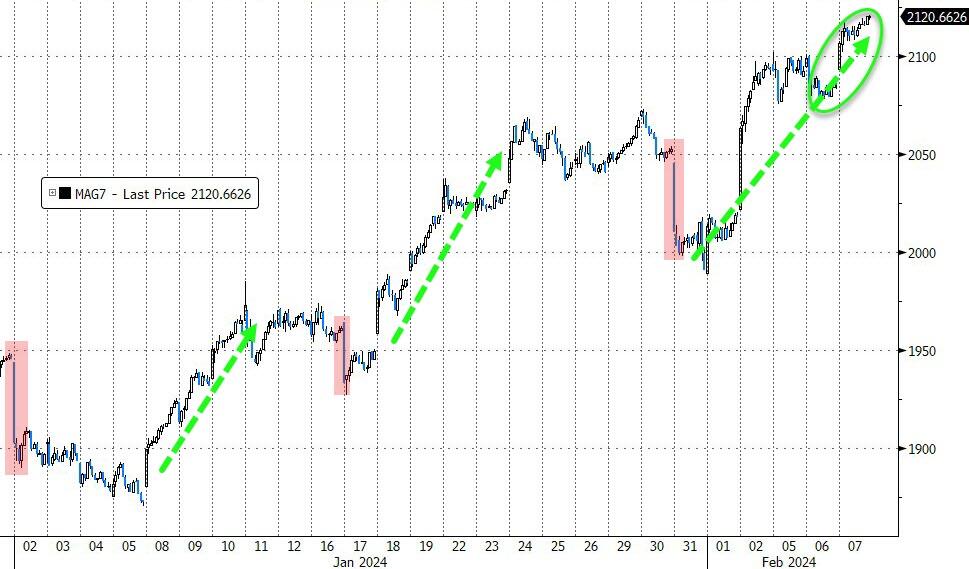
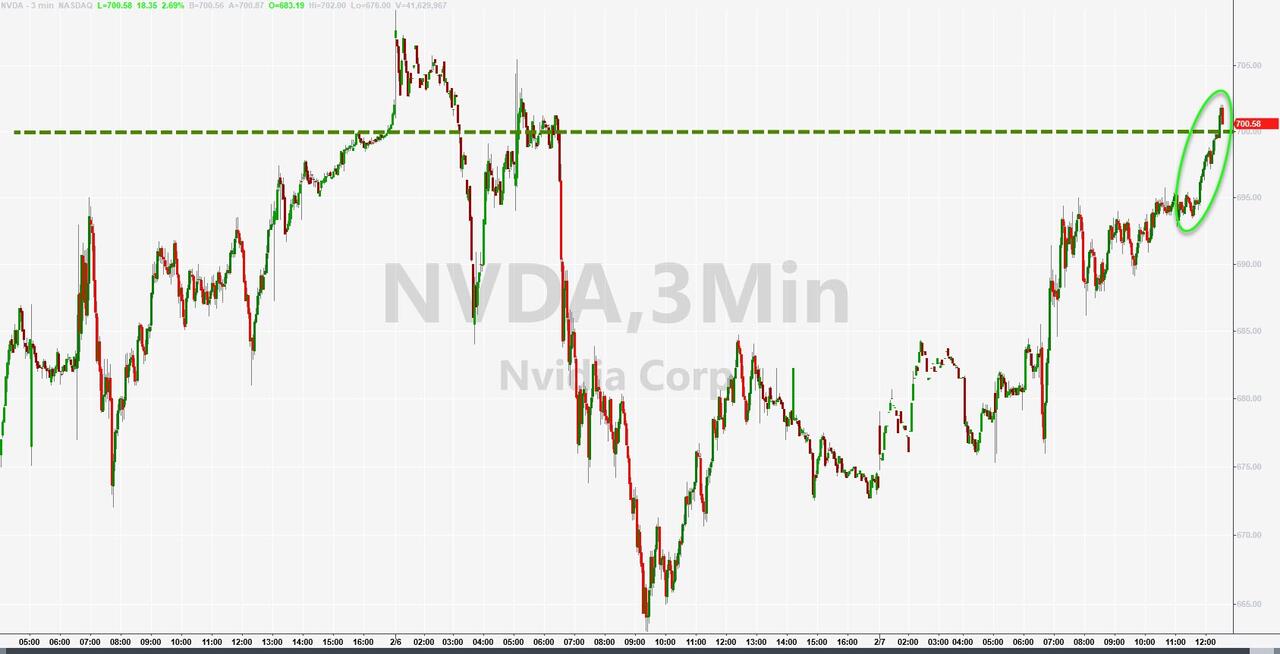
The Nasdaq did not care, though, as it led the rally with the Mag7 stocks hitting new highs. NVDA reclaimed its $700 throne, while the others followed suit.
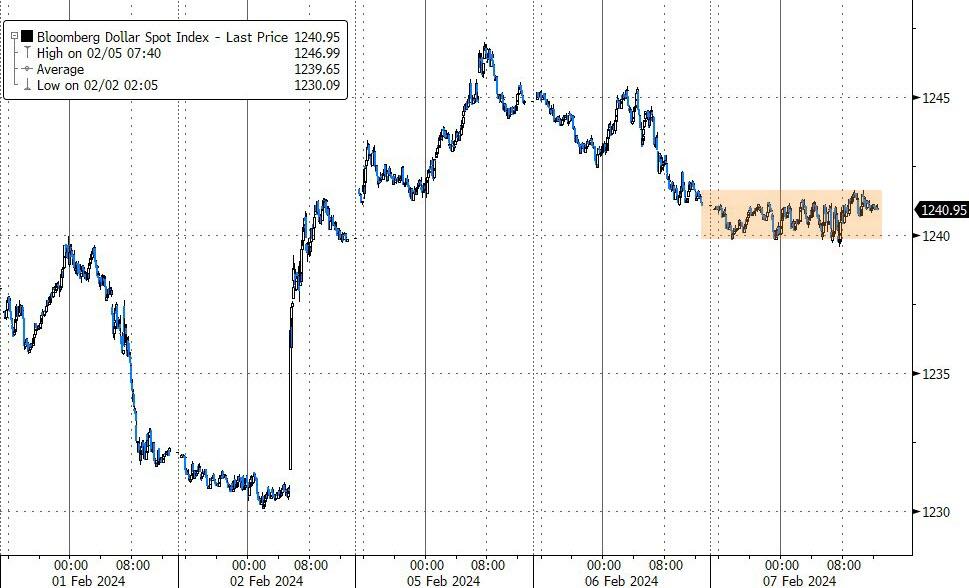
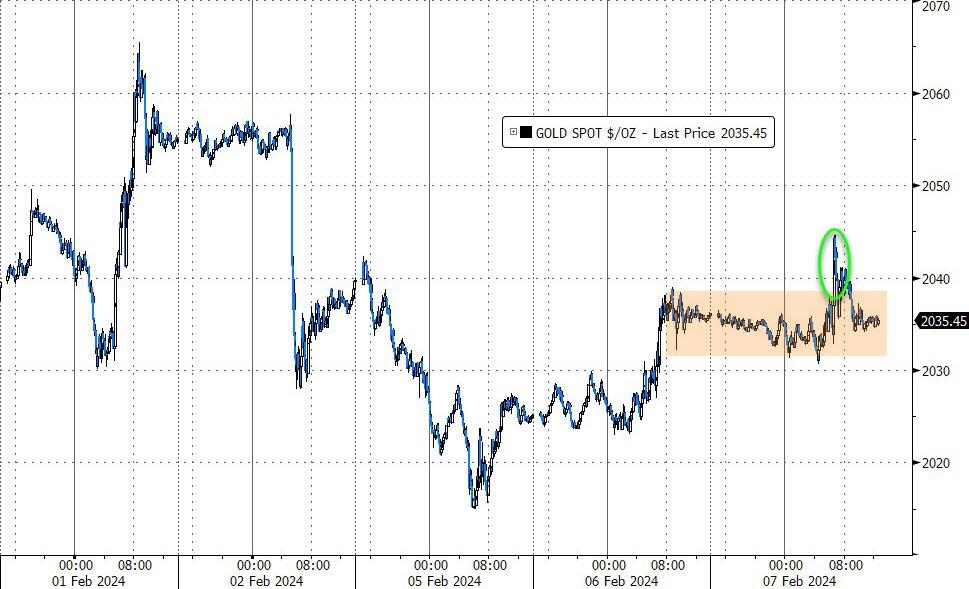
The rally happened despite rising bond yields, which usually hurt stocks. The dollar was flat, gold was choppy, and oil was up.
ZeroHedge thinks this is all a repeat of the 1999-2001 bubble, and that the expiration of the BTFP (Bank Term Funding Program) will end it all at the top.
But maybe they are wrong, and this time is different.
2. Current “Buy” Cycles (effective 11/21/2023)
Our Trend Tracking Indexes (TTIs) have both crossed their trend lines with enough strength to trigger new “Buy” signals. That means, Tuesday, 11/21/2023, was the official date for these signals.
If you want to follow our strategy, you should first decide how much you want to invest based on your risk tolerance (percentage of allocation). Then, you should check my Thursday StatSheet and Saturday’s “ETFs on the Cutline” report for suitable ETFs to buy.
3. Trend Tracking Indexes (TTIs)
The market started strong and kept rising, with the Nasdaq leading the way. The S&P 500 almost reached the $5,000 mark, but some investors and algorithms sold their shares before hitting that level. Some traders worried that this could be a sign of a market downturn.
Our Trend TTIs also moved up slightly, confirming our positive view of the market.
This is how we closed 2/07/2024:
Domestic TTI: +7.59% above its M/A (prior close +7.17%)—Buy signal effective 11/21/2023.
International TTI: +7.37% above its M/A (prior close +7.19%)—Buy signal effective 11/21/2023.
All linked charts above are courtesy of Bloomberg via ZeroHedge.
———————————————————-
WOULD YOU LIKE TO HAVE YOUR INVESTMENTS PROFESSIONALLY MANAGED?
Do you have the time to follow our investment plans yourself? If you are a busy professional who would like to have his portfolio managed using our methodology, please contact me directly to get more details.
—————————————————————-
Contact Ulli