
- Moving the markets
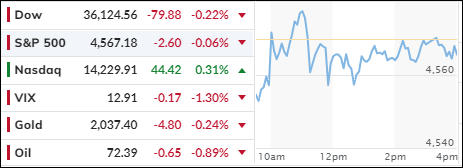
The stock market seemed to be in a daze as it drifted sideways without a clear direction. After a strong rally in the past weeks, investors seemed to lose their enthusiasm and confidence. The previous session ended with losses for the major indexes, raising doubts about the sustainability of the market’s momentum. Despite the recent slump, the indexes are still up for the quarter, showing how impressive the market’s performance was before this week.
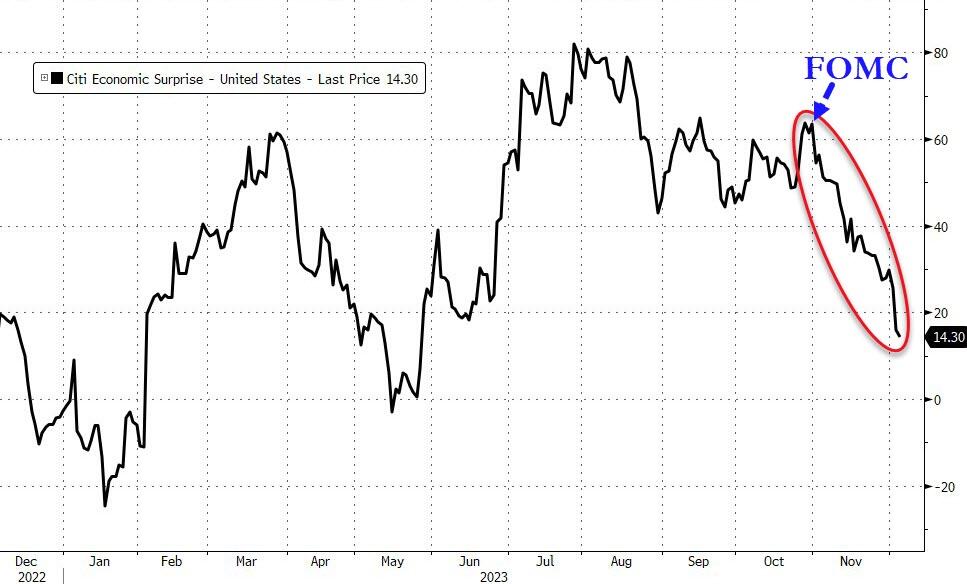
The market got a slight boost on Tuesday as the tech sector recovered some of its losses, lifting the Nasdaq into the green zone. The 10-year Treasury yield also dropped below the critical 4.2% mark, signaling a cooling off in the labor market. This came after a disappointing report on job openings, which showed a sharp decline and a downward revision of previous data. The Citi Economic Surprise index continued to slide, reflecting the gap between expectations and reality.
Meanwhile, traders are still betting on five rate cuts next year, which seems overly optimistic and wishful. Such a scenario would imply a severe economic and financial crisis, which is not very likely. BlackRock, the world’s largest asset manager, expects only one rate cut, and not until the second half of 2024.
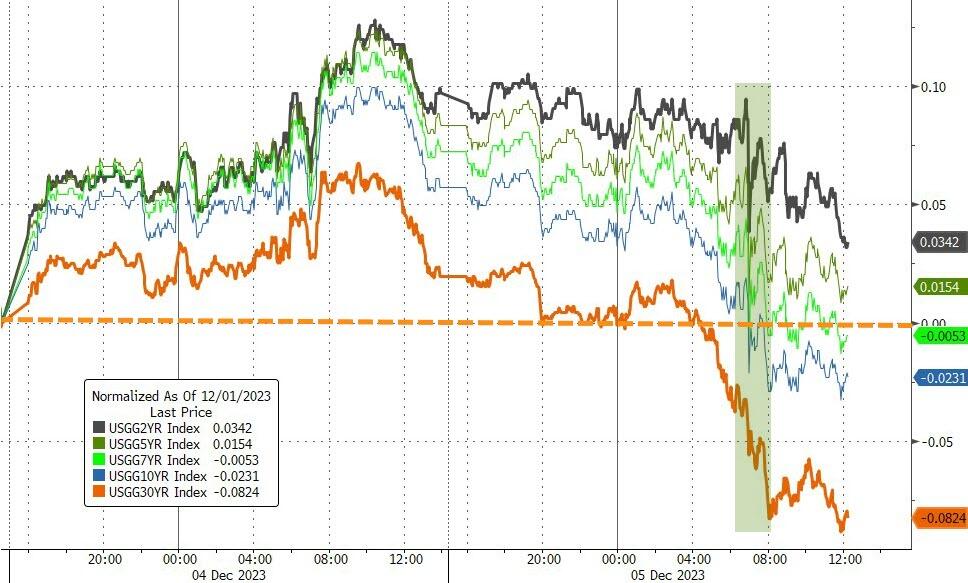
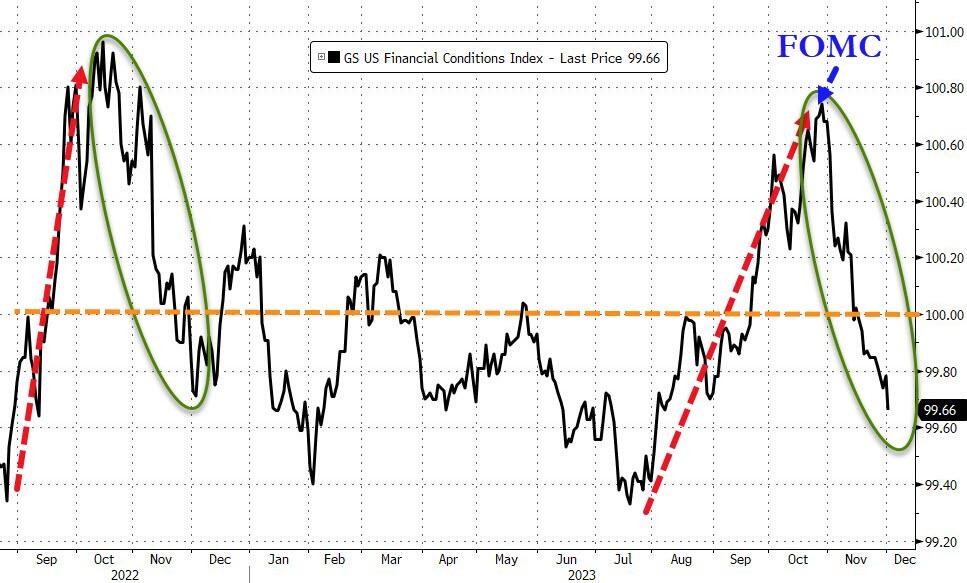
Bond yields slipped, but the 10-year and 30-year remained above Friday’s lows, indicating some resilience in the bond market. Financial conditions also eased significantly, creating a favorable environment for borrowing and lending.
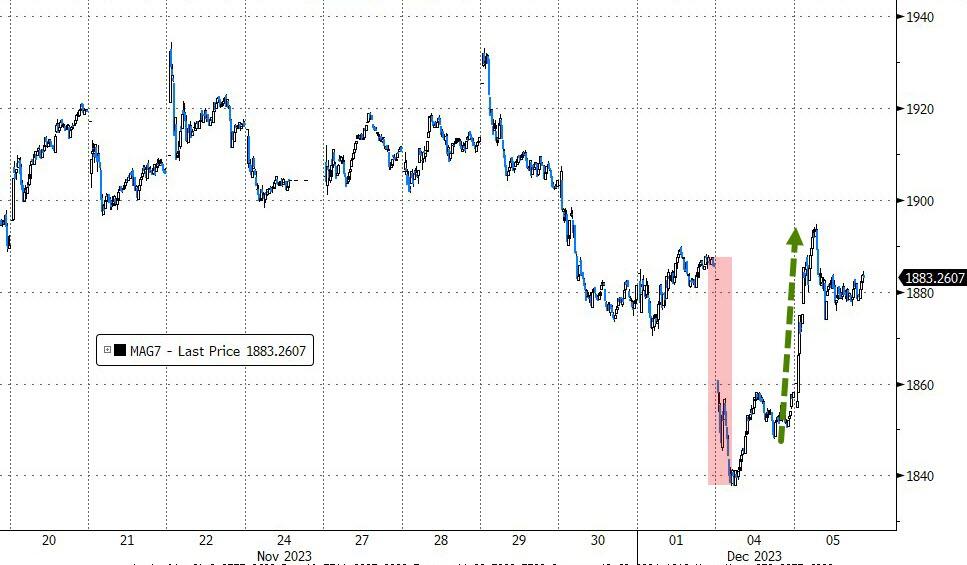
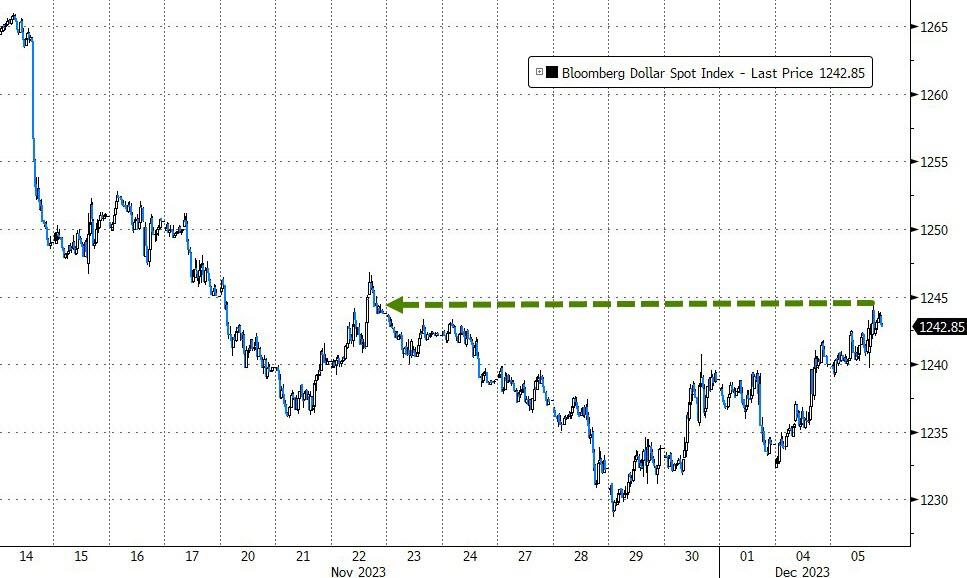
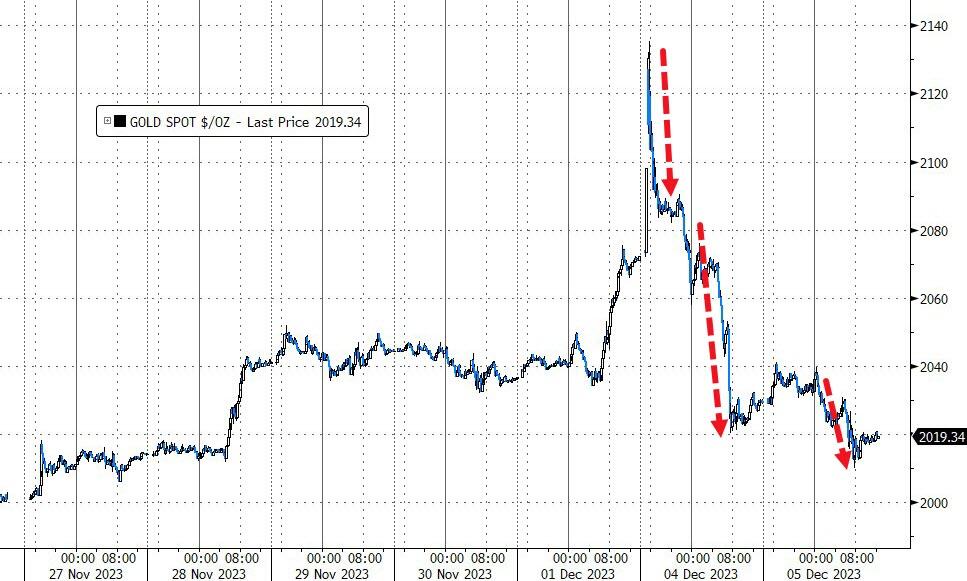
The Nasdaq managed to overcome its early weakness thanks to the rebound of the “Magnificent 7” stocks, which are the seven most influential tech companies in the market. The dollar rallied for the second day in a row, while gold retreated from its record highs two days ago.
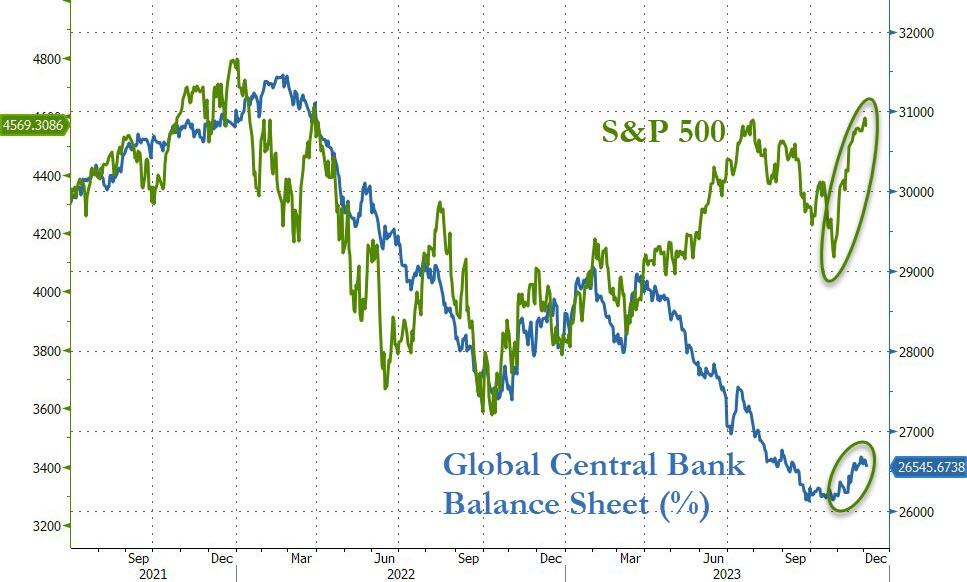
Liquidity is the key factor that drives the market movements. This chart shows the relationship between liquidity and the stock market, but it also raises a question: “How long can this divergence last?”
2. Current “Buy” Cycles (effective 11/21/2023)
Our Trend Tracking Indexes (TTIs) have both crossed their trend lines with enough strength to trigger new “Buy” signals. That means, Tuesday, 11/21/2023, was the official date for these signals.
If you want to follow our strategy, you should first decide how much you want to invest based on your risk tolerance (percentage of allocation). Then, you should check my Thursday StatSheet and Saturday’s “ETFs on the Cutline” report for suitable ETFs to buy.
3. Trend Tracking Indexes (TTIs)
The major indexes stayed almost the same, as traders were unsure about the direction of the market and worried that it was overvalued.
Our TTIs slipped a little but stayed firmly above their trend lines, indicating a bullish market.
This is how we closed 12/05/2023:
Domestic TTI: +3.50% above its M/A (prior close +4.43%)—Buy signal effective 11/21/2023.
International TTI: +3.91% above its M/A (prior close +4.20%)—Buy signal effective 11/21/2023.
All linked charts above are courtesy of Bloomberg via ZeroHedge.
Contact Ulli