
- Moving the markets
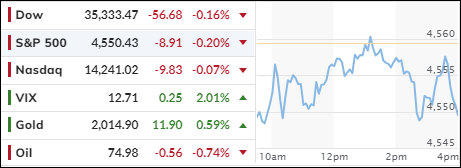
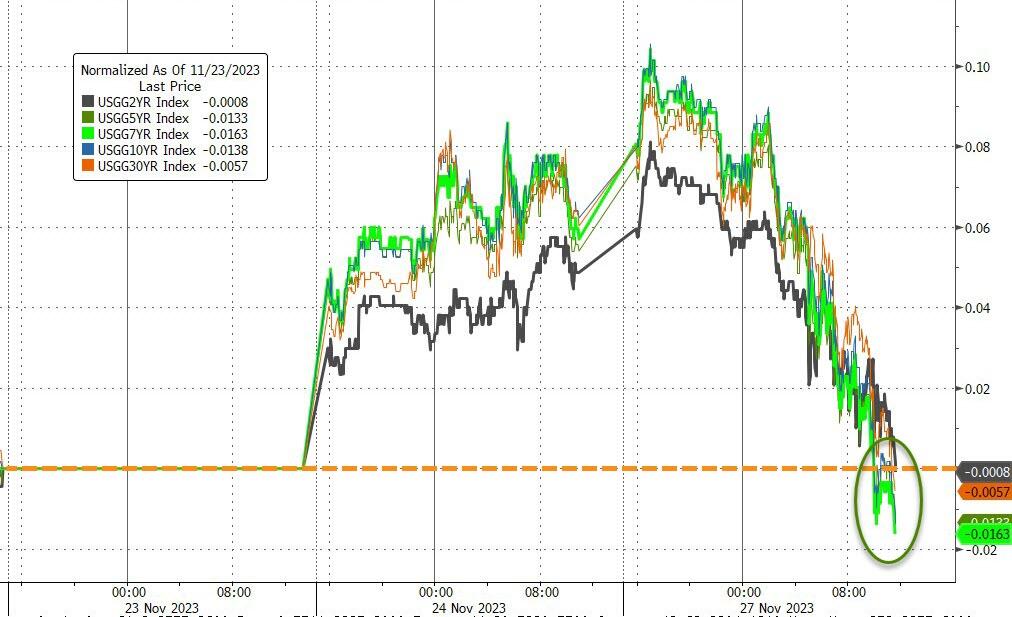
The stock market took a break from its recent rally on Monday, as investors digested the mixed signals from the economy and the Fed. The major indexes fell, ending a four-week winning streak, as the 10-year Treasury yield dropped below 5% after briefly touching that level in late October.
The market shrugged off the warnings from some U.S. retailers that consumer spending is slowing down, even though online sales on Black Friday rose 7.5% year-over-year. Perhaps the weak spending data is a sign that the Fed’s rate hikes are finally having an impact on the economy. Some traders are betting that the Fed is done with raising rates and may even start cutting them in 2024.
The 10-year Treasury yield will be a key factor for the market, especially after this week’s Fed comments and the data on consumer confidence and inflation, which are due on Thursday.
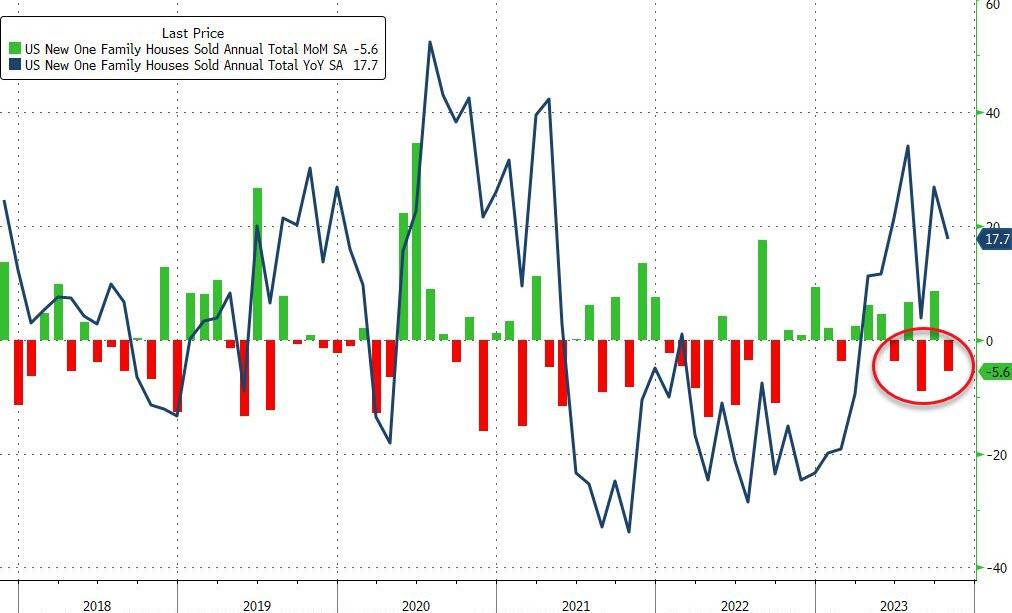
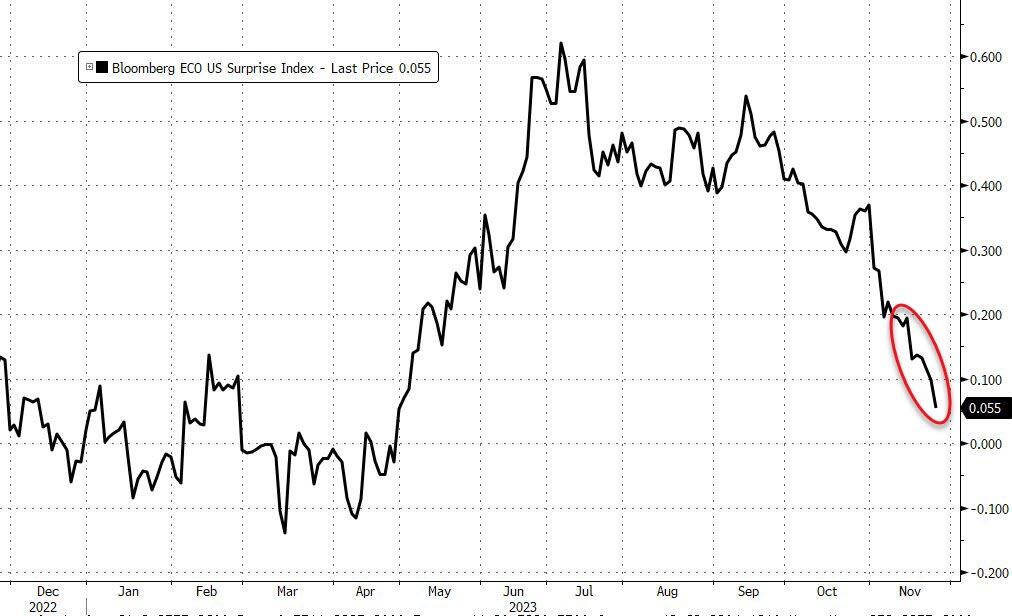
The housing market also showed signs of weakness, as new home sales fell 5.6% month-over-month in October, worse than expected. The September figure was also revised down from 12.3% to 8.6%. Ouch! The dismal home sales, along with the contraction in Texas manufacturing, dragged down the U.S. macro data.
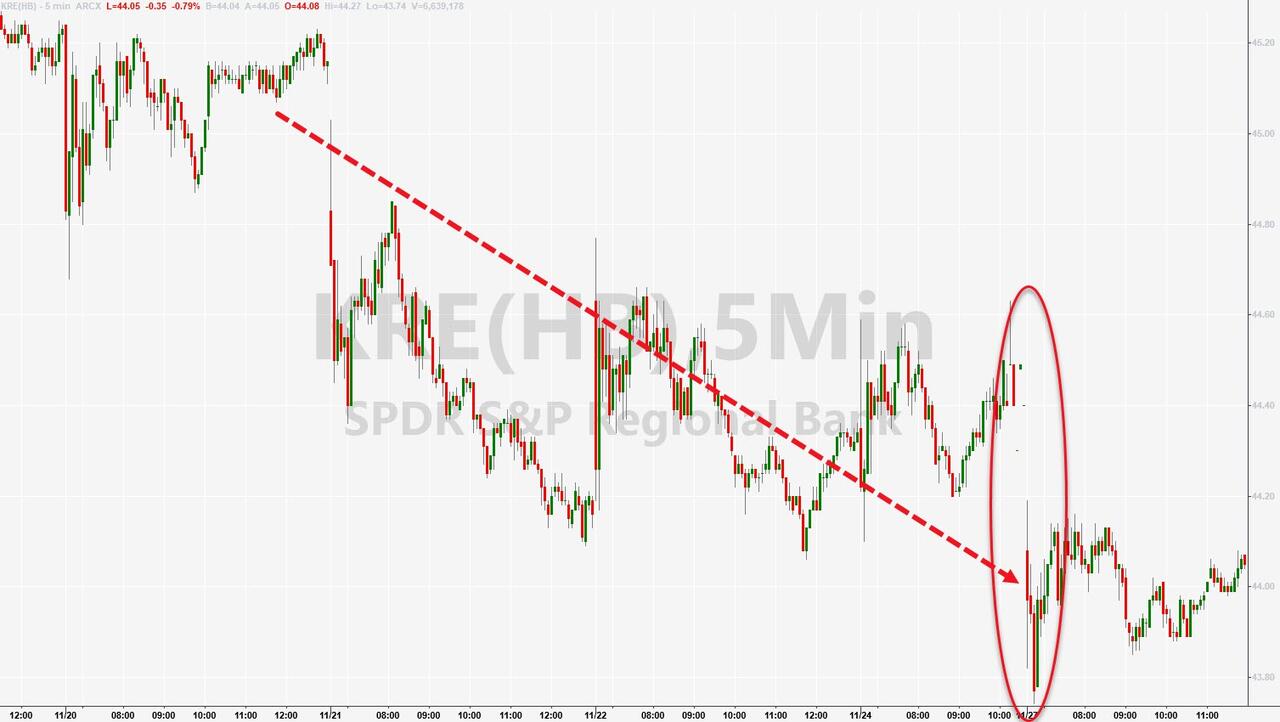
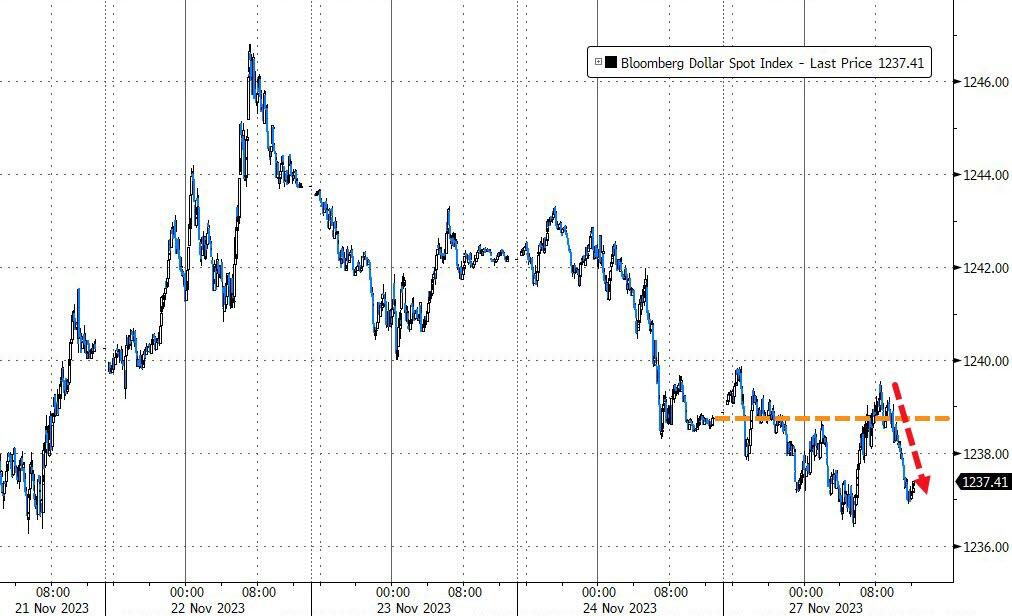
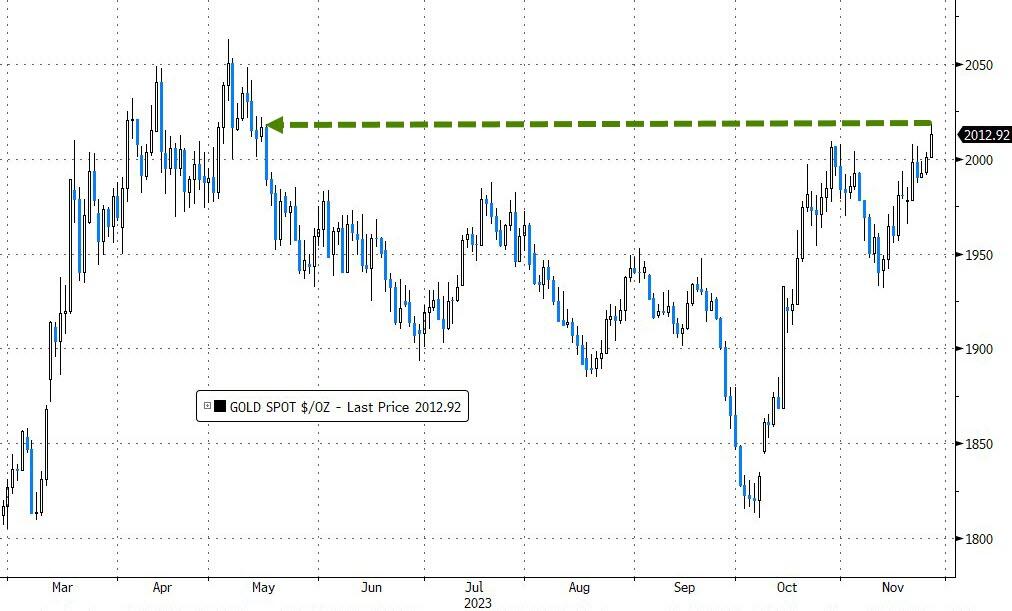
The bond market reacted to the gloomy news, as did the homebuilders and the banks. The dollar continued its slide, which boosted gold to its highest level since May.
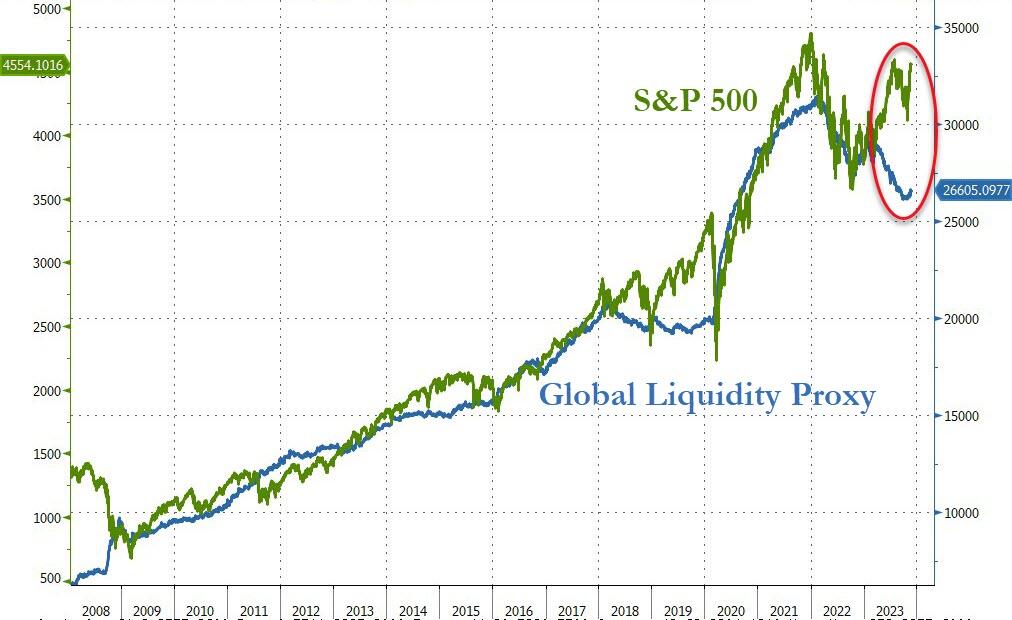
As ZeroHedge pointed out in this chart, the S&P 500 is trading way above its fair value based on global liquidity. We know that such divergences don’t last forever, but which way will they resolve? Will the S&P 500 come down to earth, or will the global liquidity catch up?
History suggests that the S&P 500 may have to eat some humble pie—sooner or later.
2. Current “Buy” Cycles (effective 11/21/2023)
Our Trend Tracking Indexes (TTIs) have both crossed their trend lines with enough strength to trigger new “Buy” signals. That means, Tuesday, 11/21/2023, was the official date for these signals.
If you want to follow our strategy, you should first decide how much you want to invest based on your risk tolerance (percentage of allocation). Then, you should check my Thursday StatSheet and Saturday’s “ETFs on the Cutline” report for suitable ETFs to buy.
3. Trend Tracking Indexes (TTIs)
The markets were unstable and showed little change by the end of the day. Our TTIs declined slightly, as the main stock indicators finished with small losses.
This is how we closed 11/27/2023:
Domestic TTI: +1.71% above its M/A (prior close +1.92%)—Buy signal effective 11/21/2023.
International TTI: +3.26% above its M/A (prior close +3.50%)—Buy signal effective 11/21/2023.
All linked charts above are courtesy of Bloomberg via ZeroHedge.
Contact Ulli