
- Moving the markets
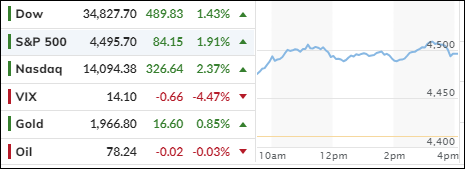
Stocks soared on Tuesday, continuing their impressive November rally, as investors celebrated a mild inflation report that suggested the Fed might be done raising interest rates.
Tuesday’s gains added to the remarkable recovery this month for stocks. The S&P 500 is up 7.3%, erasing the losses since our “Sell” signal on 9/22/2023. See section 3 below for the latest update.
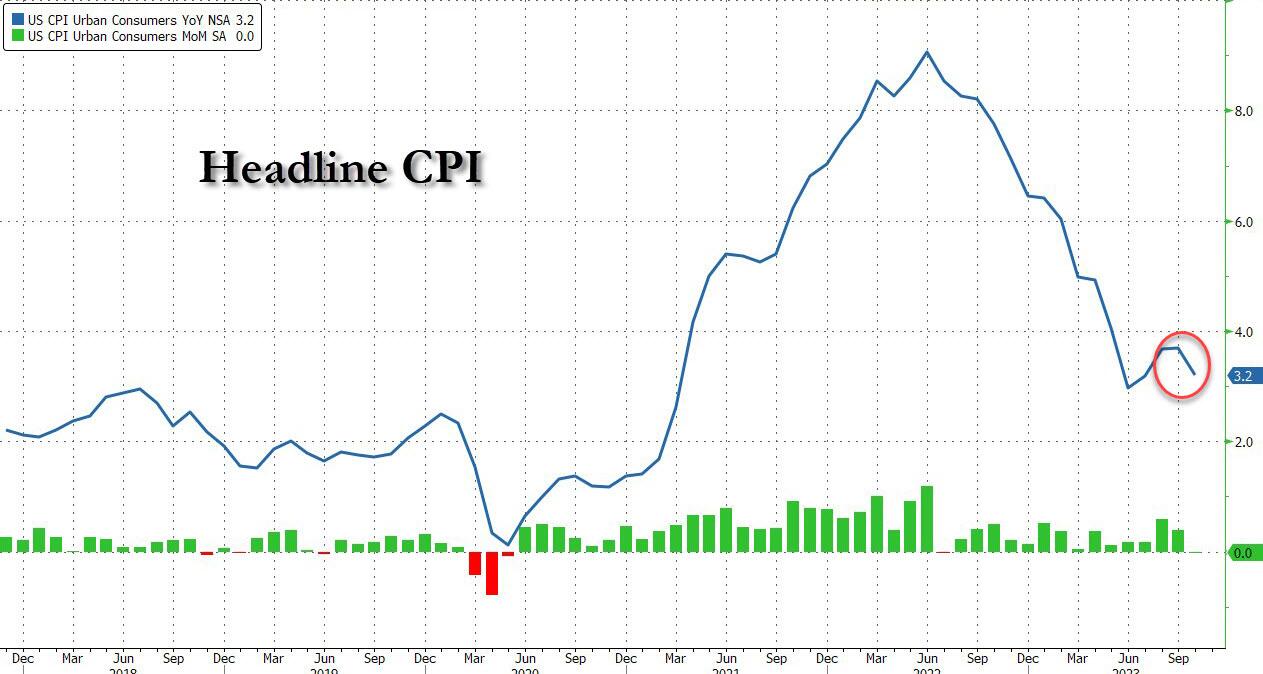
The catalyst for today’s surge was the CPI, which came in at 3.2%, lower than the 3.3% expected, while the monthly CPI was flat (0.0%), below the consensus of a 0.1% increase, and much lower than last month’s 0.4% rise.
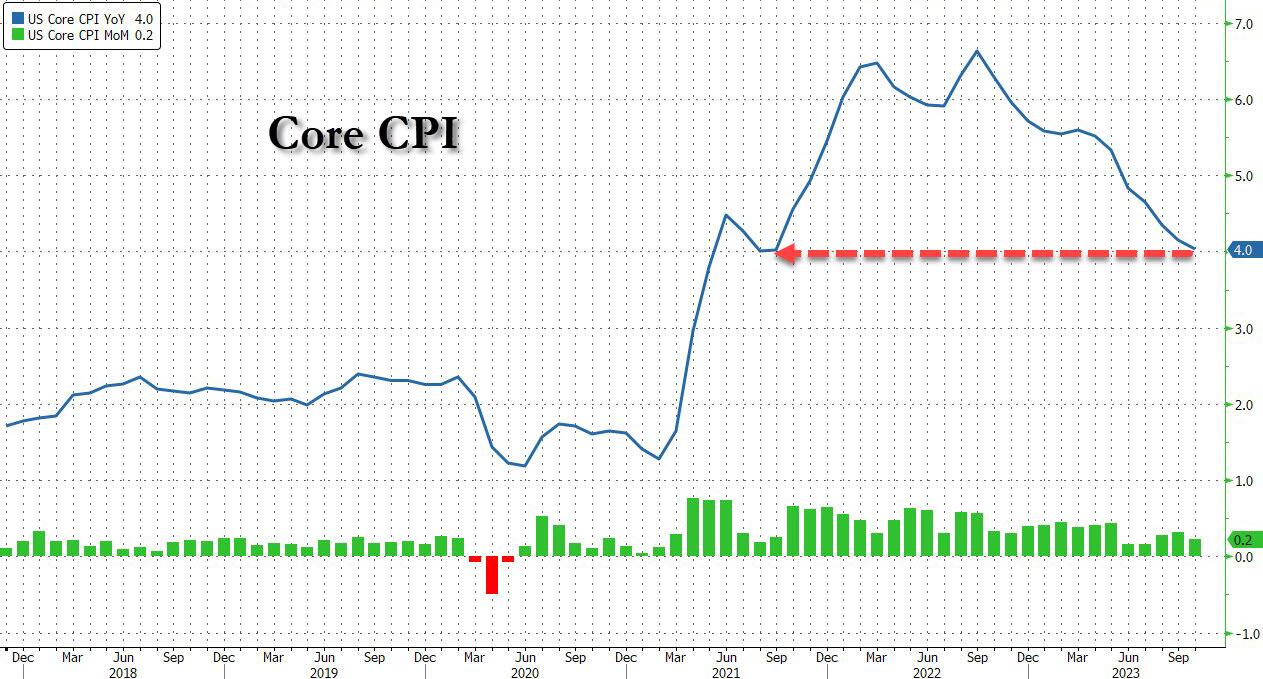
The core CPI, which excludes food and energy prices, was also weaker than expected and the slowest in two years.
This sparked optimism in the market that the Fed could finally put an end to its rate-hiking cycle for good. After the report, fed-funds futures showed that traders eliminated any chance of a hike in December, from 14% odds before, which sent the market soaring.
A tweet by Fed insider Nick Timiraos, aka Nikileaks, confirmed that the Fed is now done with its hiking spree.
The 10-year Treasury yield, which spooked stock investors by jumping over 5% in October, plunged to 4.44% after the soft inflation report. Traders are convinced that the Fed’s last rate hike was indeed in July.
While this news ignited bullish sentiment, some analysts warn that inflation is far from being tamed and will likely pick up again soon. Bloomberg’s macro strategist Simon White points to the following factors:
- Large fiscal deficits are boosting corporate profits, which are now the main driver of corporate prices.
- A rebound in goods inflation reinforcing high services inflation.
- Rising price growth in China that will spill over to global inflation pressures.
I agree with him, but for now, caution is out the window, and this bear market bounce could turn into a new bull market. Even bank stocks jumped on the hope that the economy could avoid a recession.
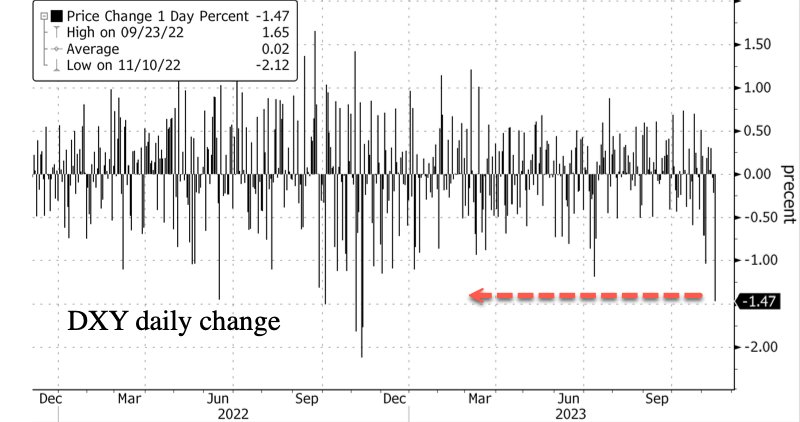
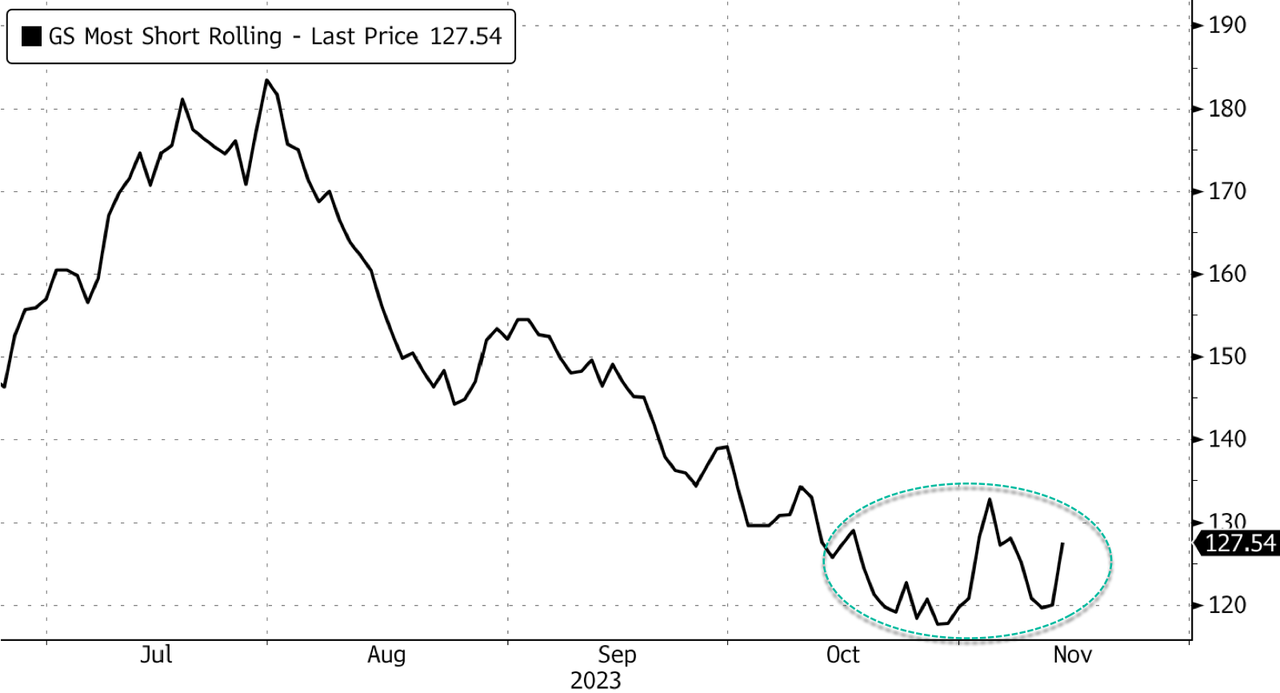
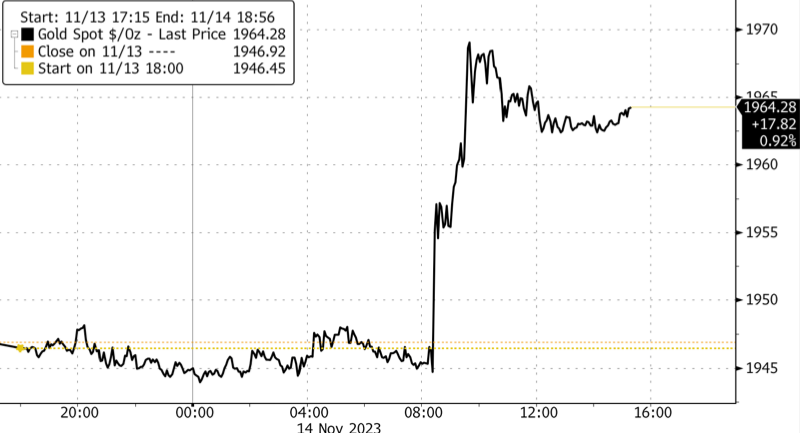
Bond yields dropped, as the dollar had its biggest daily decline since November 11, 2022, and the most shorted stocks were squeezed. As the dollar tanked, gold soared and is again heading towards its $2k level.
ZeroHedge reported that on average it takes about 8 months from the last rate hike to the first rate cut. Does that mean March 2024 is when the Fed will finally give the market what it wants?
Or will it be too late by then?
2. “Buy” Cycle (12/1/22 to 9/21/2023)
The current Domestic Buy cycle began on December 1, 2022, and concluded on September 21, 2023, at which time we liquidated our holdings in “broadly diversified domestic ETFs and mutual funds”.
Our International TTI has now dipped firmly below its long-term trend line, thereby signaling the end of its current Buy cycle effective 10/3/23.
We have kept some selected sector funds. To make informed investment decisions based on your risk tolerance, you can refer to my Thursday StatSheet and Saturday’s “ETFs on the Cutline” report.
Considering the current turbulent times, it is prudent for conservative investors to remain in money market funds—not bond funds—on the sidelines.
3. Trend Tracking Indexes (TTIs)
The market mood changed dramatically today after a favorable CPI report. The report eased inflation fears and boosted the overall market, as well as our TTIs.
The domestic TTI barely moved above its long-term trend line, while the international TTI crossed its line more clearly. However, this was only the first positive sign, and I would like to see more confirmation before declaring the end of the current bear market.
Nevertheless, in my advisor practice, we have already started to buy some long positions and will add more if the market continues to rise.
This is how we closed 11/14/2023:
Domestic TTI: +0.29% above its M/A (prior close -2.49%)—Sell signal effective 9/22/2023.
International TTI: +1.78% above its M/A (prior close -0.13%)—Sell signal effective 10/3/2023.
All linked charts above are courtesy of Bloomberg via ZeroHedge.
Contact Ulli