
ETF Tracker StatSheet
You can view the latest version here.
THE NASDAQ’S EERIE RESEMBLANCE TO 1999: A WARNING SIGN OR A COINCIDENCE?
[Chart courtesy of MarketWatch.com]
- Moving the markets
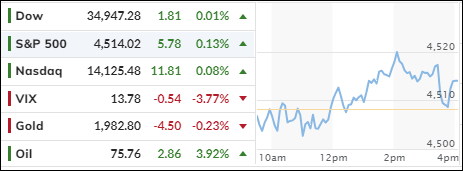
The stock market gained modestly on Friday, capping off another week of gains in a sizzling November rally. This was the third consecutive week of positive returns for all three indexes.
What fueled this bullish frenzy? Investors seemed to shrug off the worries about inflation, the Fed’s rate hikes, and the geopolitical tensions that have plagued the markets for months. Instead, they focused on the positive signs of a soft landing for the U.S. economy, with moderate growth and inflation.
The market was also cheered by some encouraging economic data, such as stronger-than-expected housing starts, an improved Philly Fed index, a smaller-than-anticipated decline in retail sales, and steady jobless claims. Additionally, Congress passed a stopgap funding bill to avert a government shutdown, easing some of the political uncertainty.
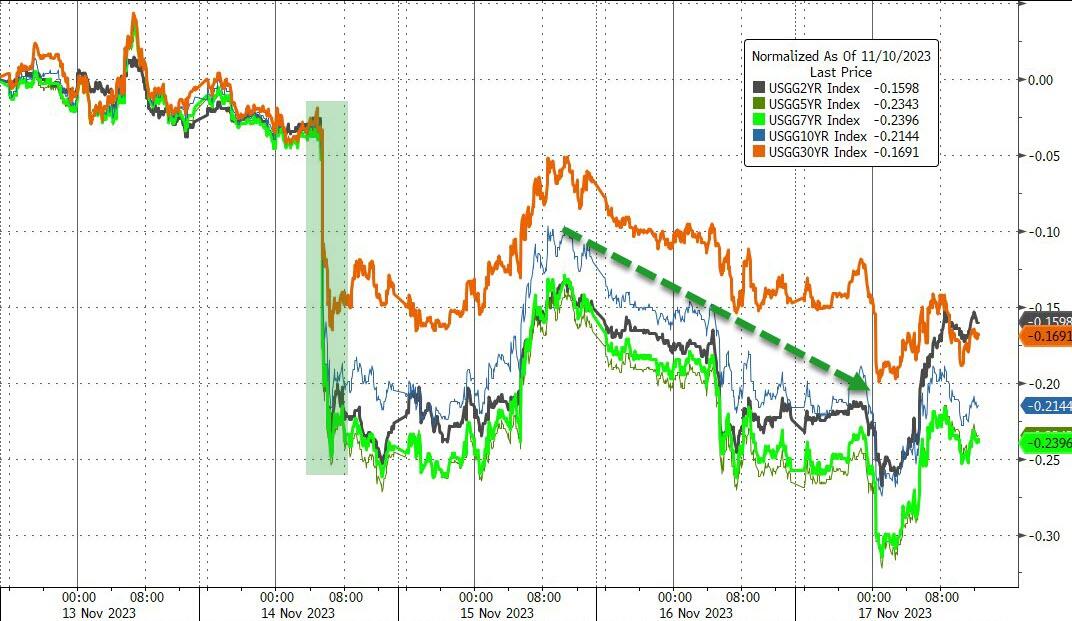
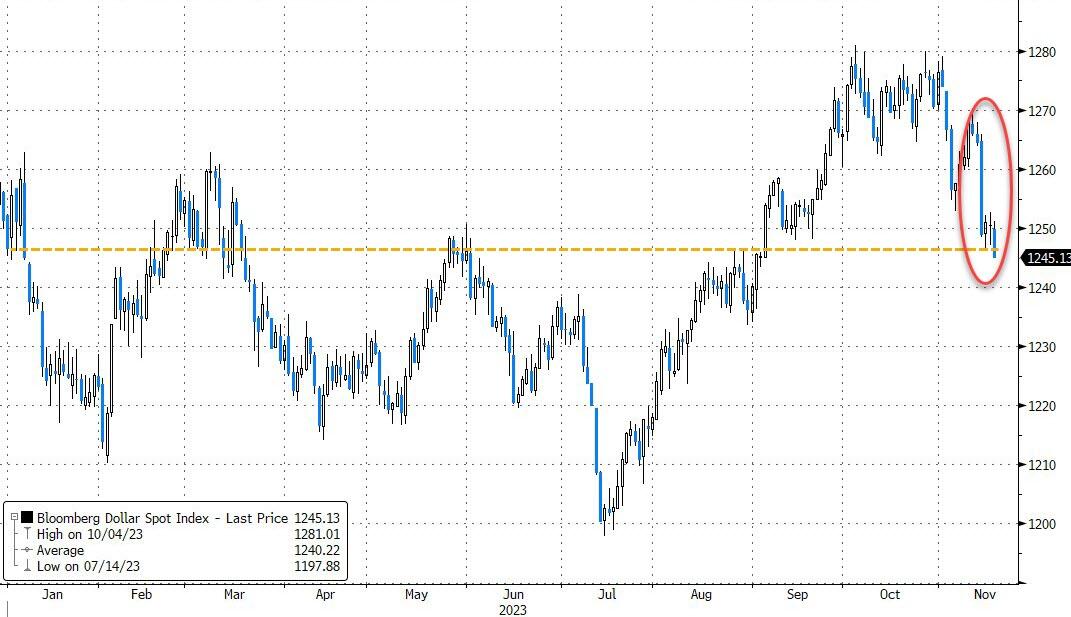
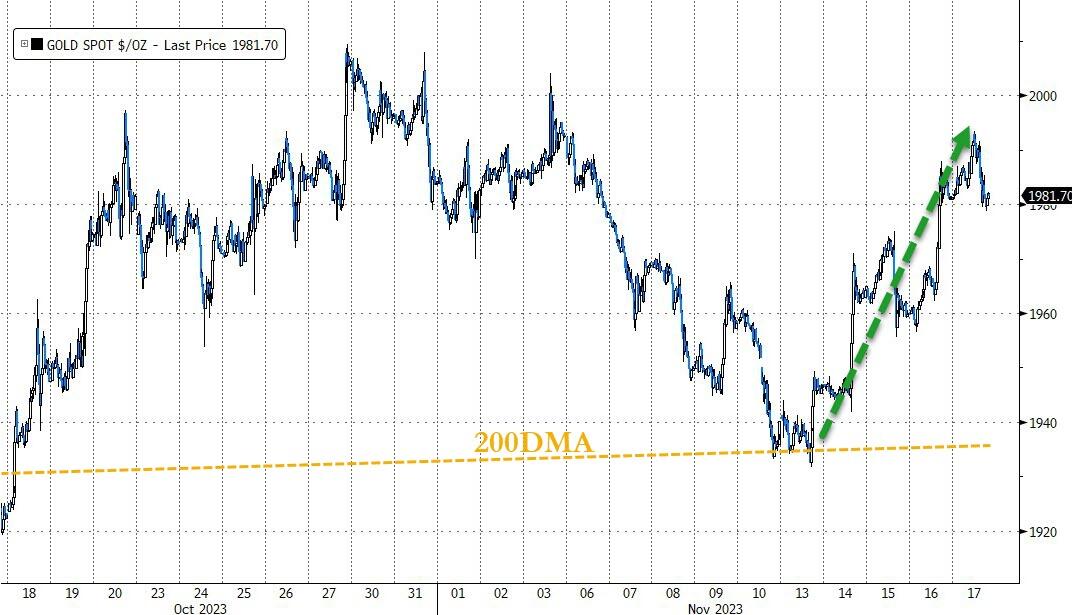
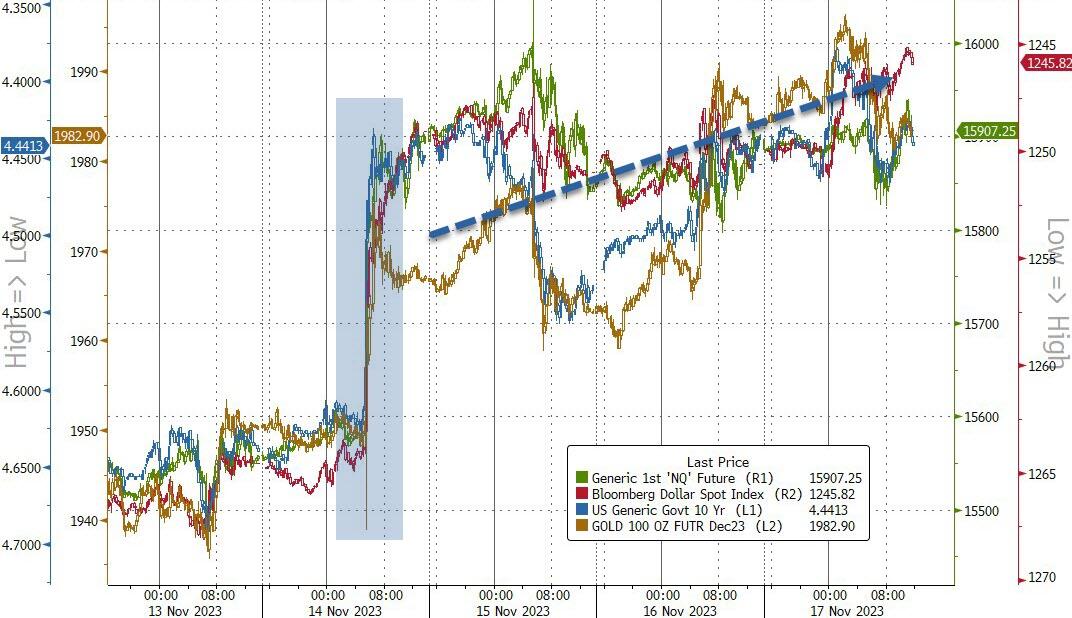
As a result, the bond market rallied, sending the 10-year Treasury yield to its lowest level since September at 4.44%. The dollar weakened, posting its second-biggest weekly drop of the year, and turning negative for 2023. Gold shone, rising over 2% for the week and bouncing off its 200-day moving average.
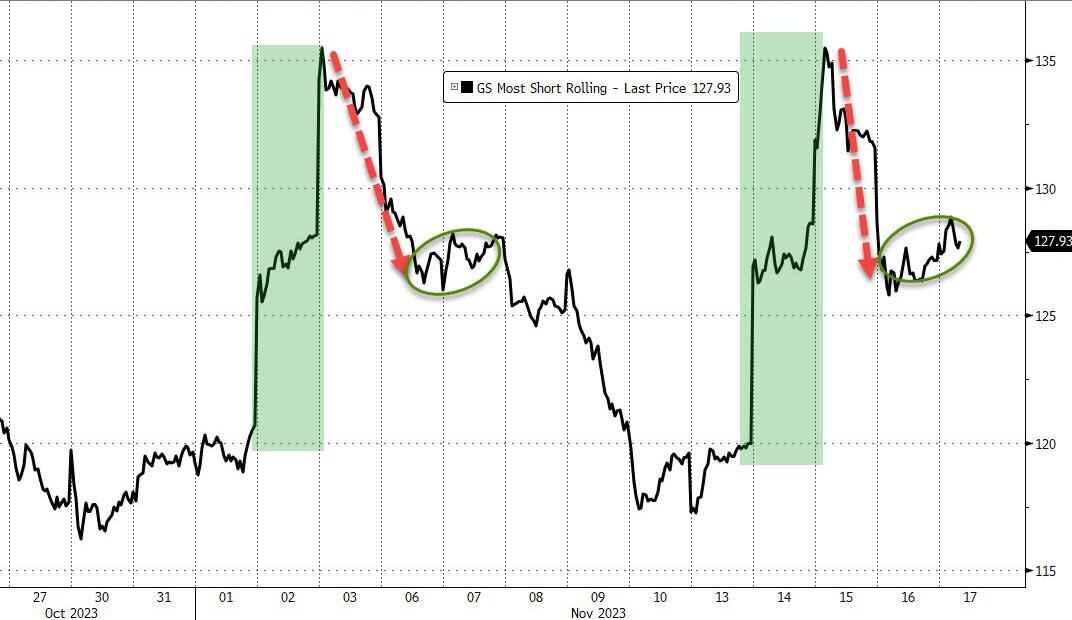
The market was also helped by a short squeeze, as some of the most heavily shorted stocks surged on Tuesday and Wednesday. The so-called “magnificent 7” stocks, which include Apple, Microsoft, Amazon, Google, Facebook, Tesla, and Netflix, broke out of their downtrend, and reached new highs.
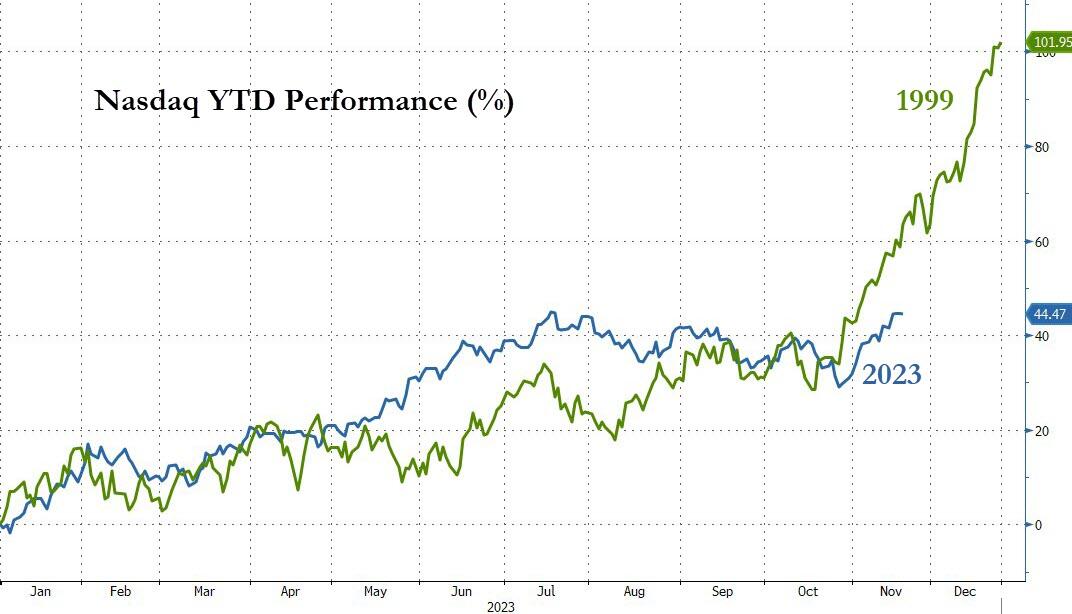
But before you pop the champagne and celebrate the return of the Goldilocks economy, you might want to look at this chart. It shows the striking similarity between the Nasdaq’s performance in 2023 and 1999, the year before the dot-com bubble burst.
Could history repeat itself? And if so, do you have an exit strategy ready? Or are you drinking Kool-Aid too?
2. “Buy” Cycle (12/1/22 to 9/21/2023)
The current Domestic Buy cycle began on December 1, 2022, and concluded on September 21, 2023, at which time we liquidated our holdings in “broadly diversified domestic ETFs and mutual funds”.
Our International TTI has now dipped firmly below its long-term trend line, thereby signaling the end of its current Buy cycle effective 10/3/23.
We have kept some selected sector funds. To make informed investment decisions based on your risk tolerance, you can refer to my Thursday StatSheet and Saturday’s “ETFs on the Cutline” report.
Considering the current turbulent times, it is prudent for conservative investors to remain in money market funds—not bond funds—on the sidelines.
3. Trend Tracking Indexes (TTIs)
The major indexes barely changed from yesterday, moving slightly up and down around their starting points. However, they ended the day with a small positive gain.
Both of our TTIs also improved, and the international one is close to giving a “Buy” signal. But I will wait until Monday to confirm this signal and cancel the current “Sell” signal, because the weekend might bring some unexpected events that could affect the market.
This is how we closed 11/17/2023:
Domestic TTI: +0.98% above its M/A (prior close +0.43%)—Sell signal effective 9/22/2023.
International TTI: +2.83% above its M/A (prior close +2.22%)—Sell signal effective 10/3/2023.
All linked charts above are courtesy of Bloomberg via ZeroHedge.
———————————————————-
WOULD YOU LIKE TO HAVE YOUR INVESTMENTS PROFESSIONALLY MANAGED?
Do you have the time to follow our investment plans yourself? If you are a busy professional who would like to have his portfolio managed using our methodology, please contact me directly to get more details.
Contact Ulli