
ETF Tracker StatSheet
You can view the latest version here.
THE GOOD, THE BAD, AND THE UGLY: AMAZON OUTPERFORMS, BUT MARKET UNDERWHELMS
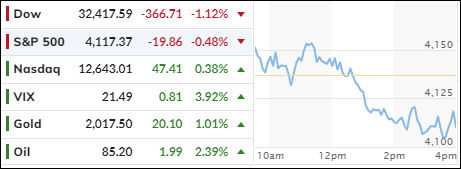
- Moving the markets
The Nasdaq tried to bounce back on Friday after a brutal week, but the S&P 500 was not in the mood and slipped into correction mode. Amazon was the star of the show, delivering a stellar quarter that beat Wall Street’s forecasts. The stock jumped more than 6% and lifted other tech giants like Alphabet and Microsoft.
Other earnings were not so rosy. Ford plunged more than 10% after missing its targets and blaming the UAW strike. Chevron also disappointed investors and shed more than 4%.
Inflation was on everyone’s mind as the Fed’s favorite measure, the core PCE, came out. It rose 0.3% in September and 3.7% year over year, in line with expectations. Consumer spending also beat estimates, rising 0.7%.
But none of that could save the market from a dismal week. The Dow, the S&P 500, and the Nasdaq all lost more than 2%, dragged down by Meta Platforms and Alphabet’s woes.
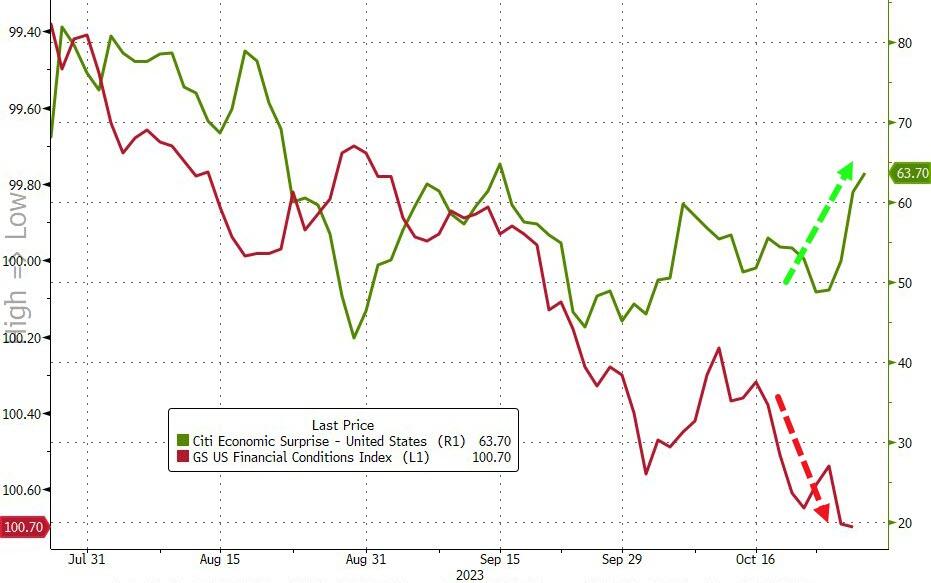
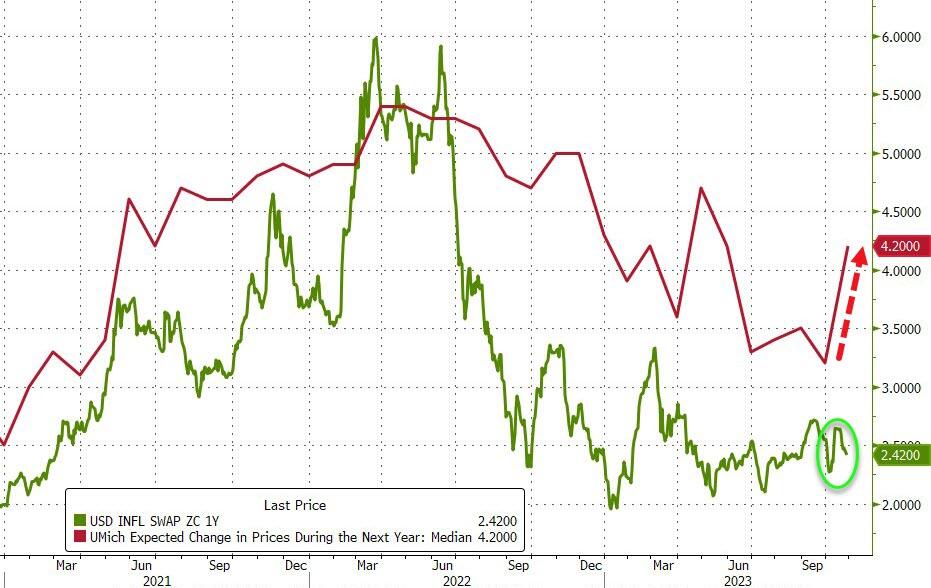
The big picture was not much better. US macro data was surprisingly strong, but financial conditions were tight, as this chart shows. Inflation expectations diverged sharply between the market and consumers. Who has it right?
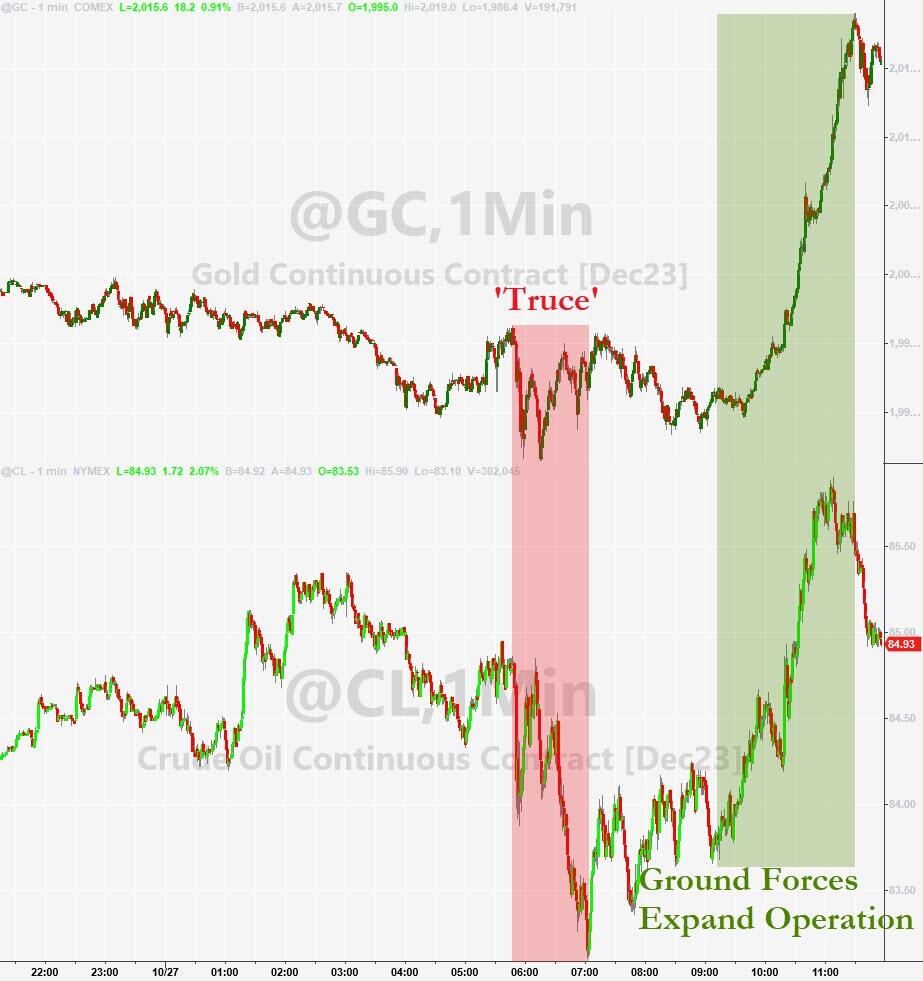
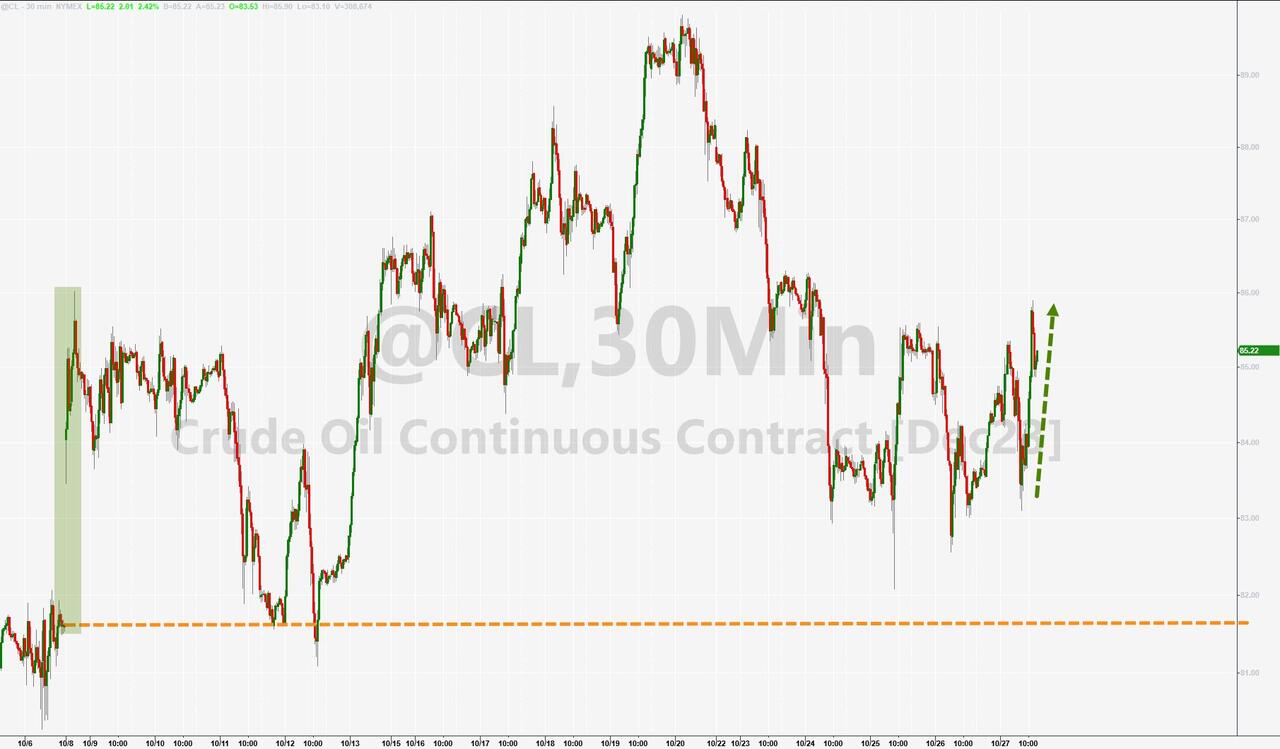
Gold and oil went on a roller coaster ride, as the Middle East conflict escalated and de-escalated.
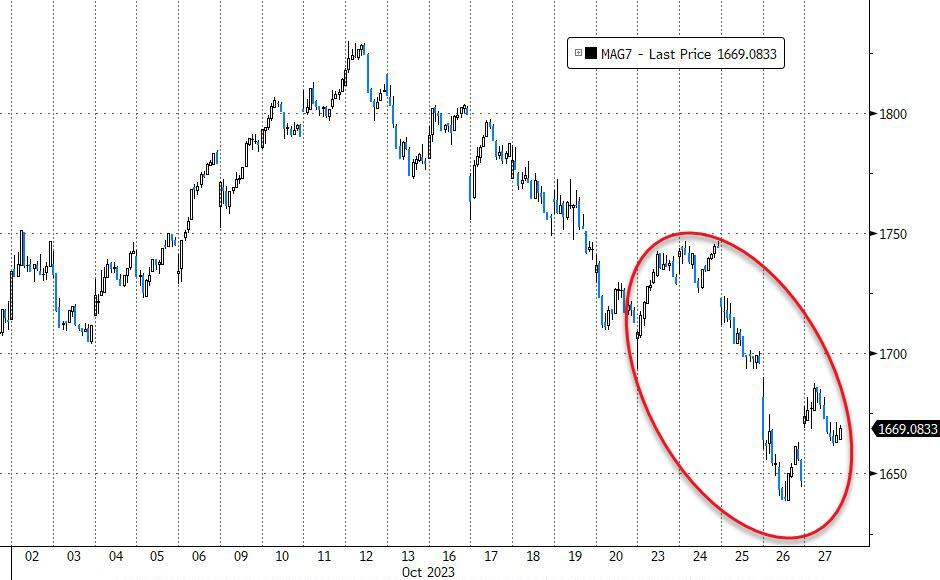
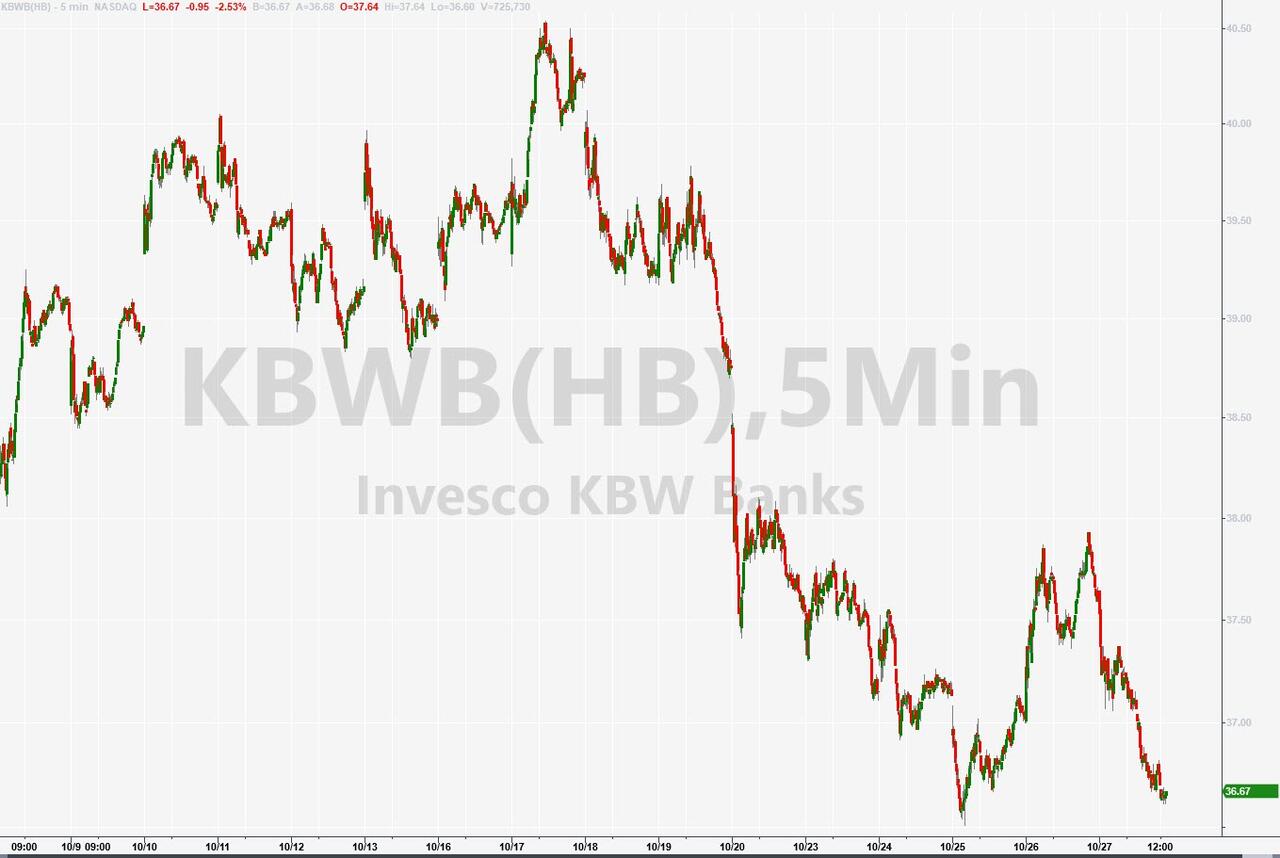
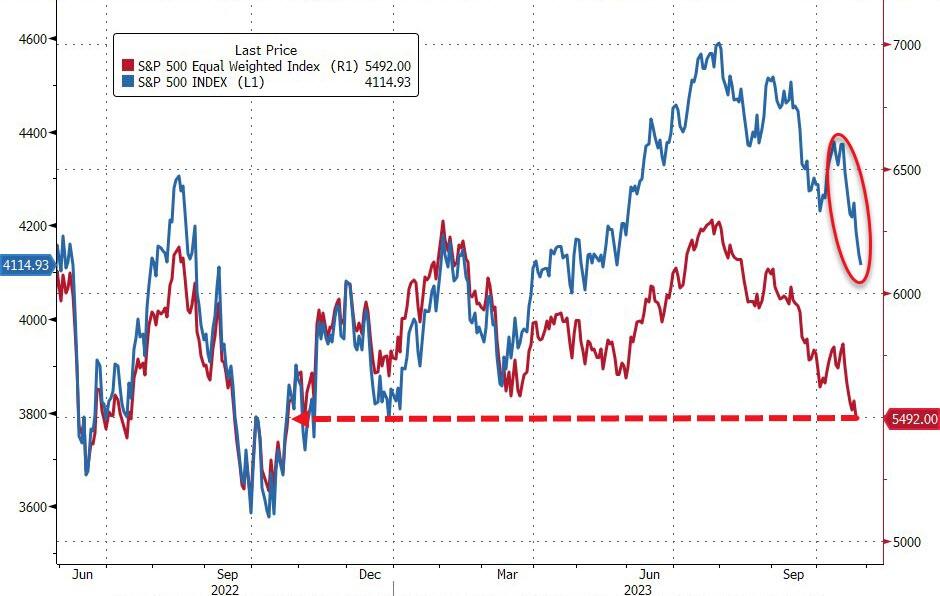
The major indexes gave up their early gains and closed lower. The Nasdaq suffered another losing week, and so did the Magnificent 7, hitting their lowest level since May 2023. Banks also took a beating. The equal-weight S&P hit a one-year low, and the cap-weighted S&P was catching up fast.
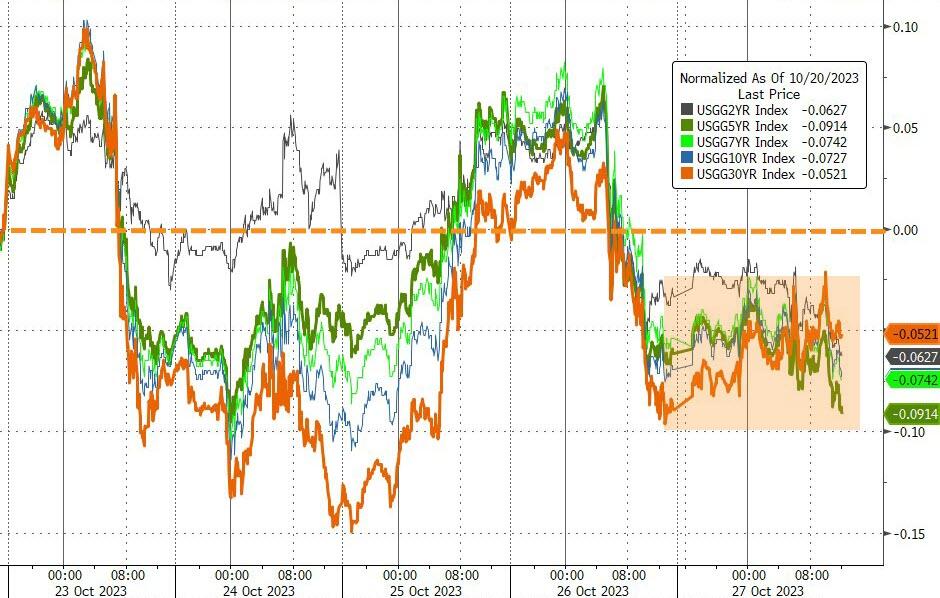
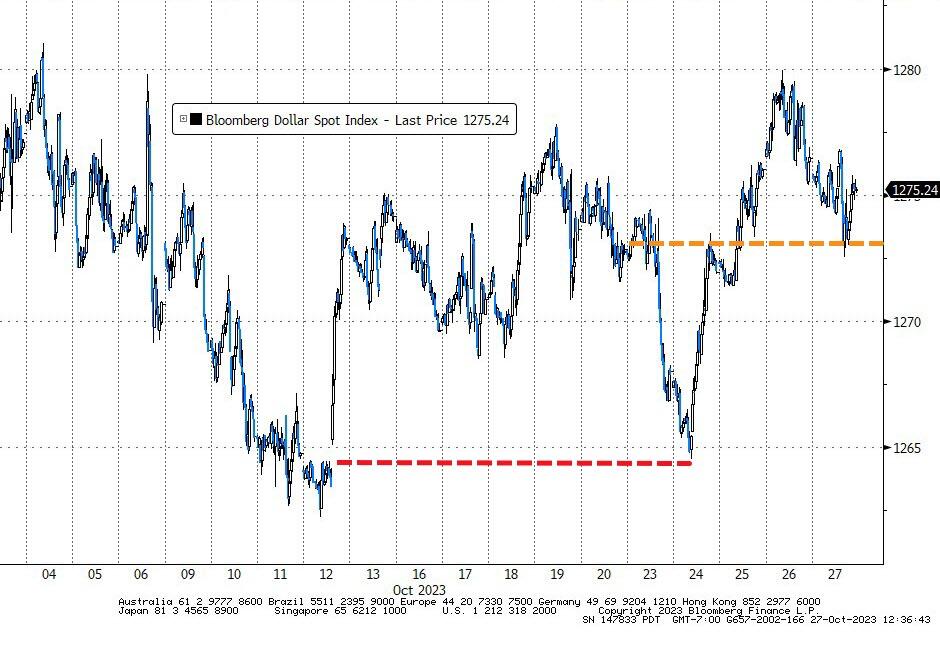
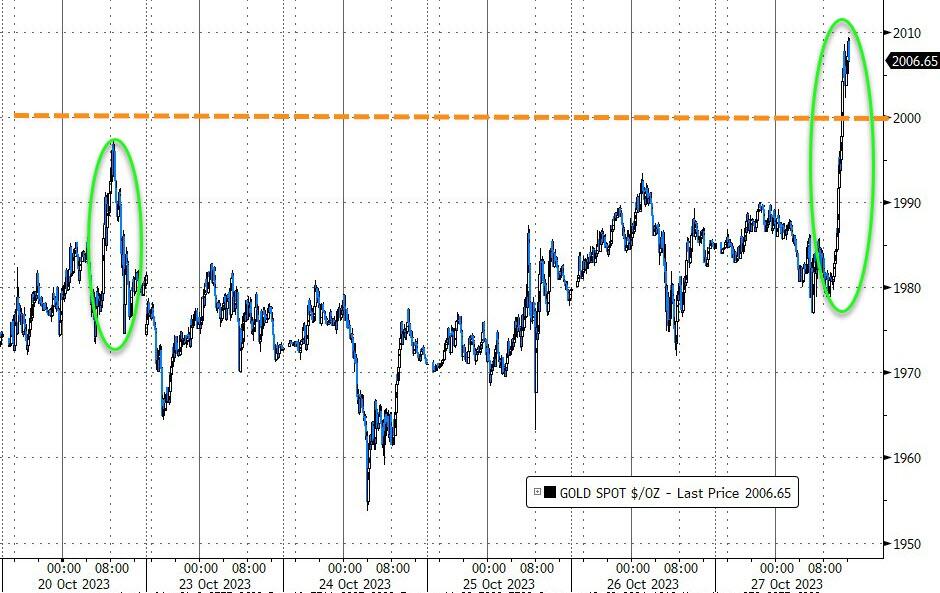
Bond yields retreated after spiking earlier in the week, the dollar edged higher, oil dropped 4%, but gold soared on Gaza fears and broke above $2k, its highest since May.
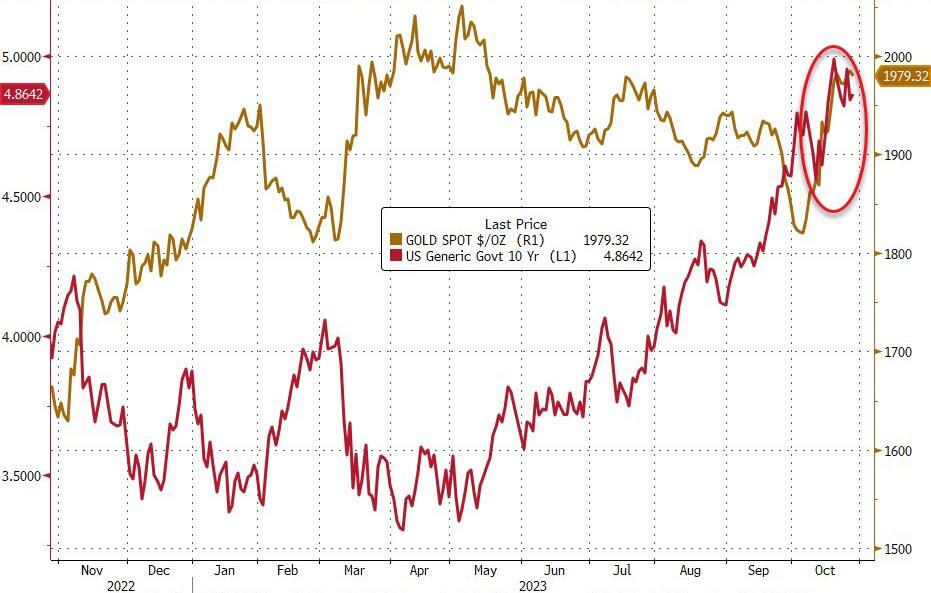
Interestingly, gold is now rising with bond yields, a rare occurrence indeed. Is this a sign of trouble for the dollar?
2. “Buy” Cycle (12/1/22 to 9/21/2023)
The current Domestic Buy cycle began on December 1, 2022, and concluded on September 21, 2023, at which time we liquidated our holdings in “broadly diversified domestic ETFs and mutual funds”.
Our International TTI has now dipped firmly below its long-term trend line, thereby signaling the end of its current Buy cycle effective 10/3/23.
We have kept some selected sector funds. To make informed investment decisions based on your risk tolerance, you can refer to my Thursday StatSheet and Saturday’s “ETFs on the Cutline” report.
Considering the current turbulent times, it is prudent for conservative investors to remain in money market funds—not bond funds—on the sidelines.
3. Trend Tracking Indexes (TTIs)
The major indexes suffered another week of losses. As a result, our Domestic TTI fell further below its long-term moving average, indicating a negative market trend.
This is not a favorable environment for investing in equities, so we are staying out of the market and avoiding losses.
This is how we closed 10/27/2023:
Domestic TTI: -7.58% below its M/A (prior close –6.76%)—Sell signal effective 9/22/2023.
International TTI: -4.33% below its M/A (prior close -3.97%)—Sell signal effective 10/3/2023.
All linked charts above are courtesy of Bloomberg via ZeroHedge.
———————————————————-
WOULD YOU LIKE TO HAVE YOUR INVESTMENTS PROFESSIONALLY MANAGED?
Do you have the time to follow our investment plans yourself? If you are a busy professional who would like to have his portfolio managed using our methodology, please contact me directly to get more details.
Contact Ulli