
- Moving the markets
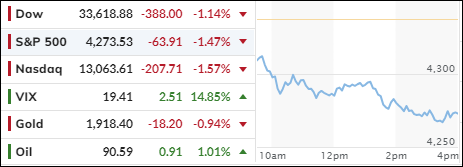
The market had a terrible day today, as dismal reports on home sales and consumer confidence sent the S&P 500 to its lowest level in months. The index plunged 1.47%, breaking below 4,300 for the first time since June 9.
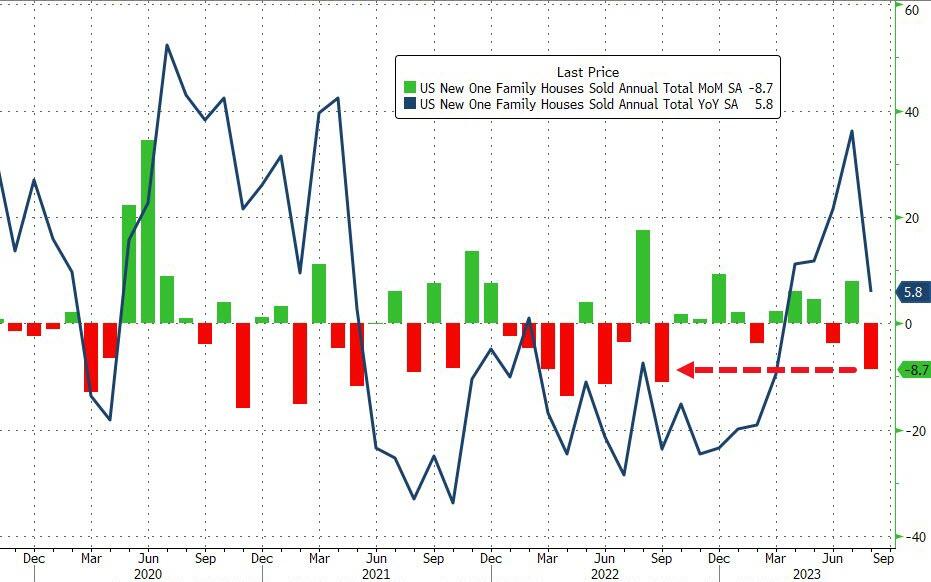
The housing market showed signs of cooling down, as new home sales in August crashed and burned. Only 675,000 homes were sold, far below the expected 695,000. That’s a 2.7% drop from July, which was already revised lower.
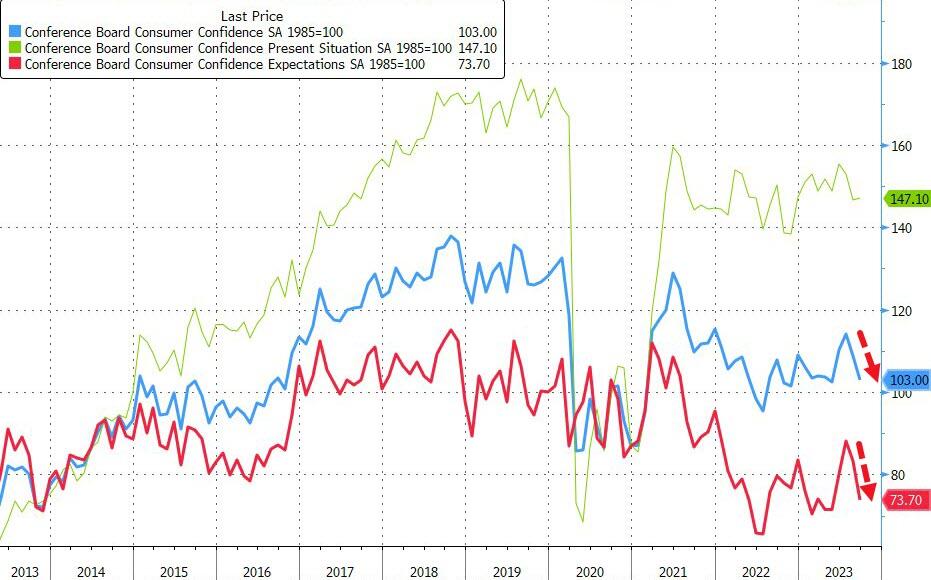
Consumers were not feeling too confident either, as the Conference Board’s index fell to 103 in September, down from 108.7 in August. Economists were hoping for 105.5, but they were disappointed again. The index hit 73.7, a level that usually means trouble for the economy. Ouch indeed!
JPMorgan Chase CEO Jamie Dimon added salt to the wound, warning that interest rates may need to rise further to fight inflation. He said that going from 5% to 7% would be more painful than going from 3% to 5%. He asked businesspeople if they were prepared for something like 7%, or even worse, stagflation.
He urged his clients to be prepared for stress in the system. That dose of realism did not help the market’s mood for the month. The Nasdaq Composite is down more than 6% in September, while the S&P 500 and Dow lost more than 5% and 3%, respectively.
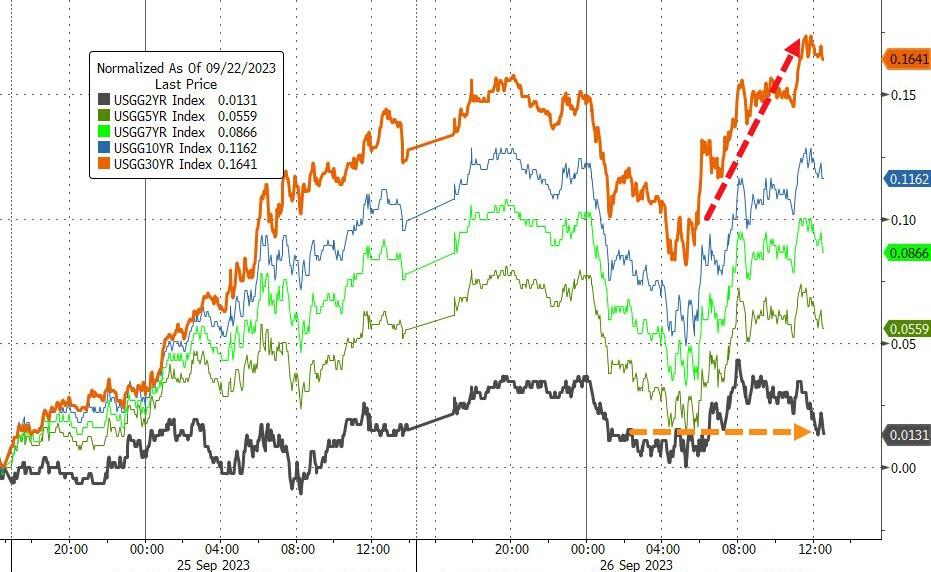
One of the reasons for the sell-off is the Federal Reserve signaling fewer rate cuts next year. That pushed the benchmark 10-year Treasury yield to levels not seen since 2007.
Traders are on edge, nervous, and uncertain about what the rise in bond yields means for the economy, the stock market, the Fed, and the dollar. With clarity lacking, the best strategy is to simply lighten up on positions.
And if the above is not enough, we have a potential government shutdown looming, and we are heading into the “jinx month” of October, notorious for the 1929 and 1987 crashes.
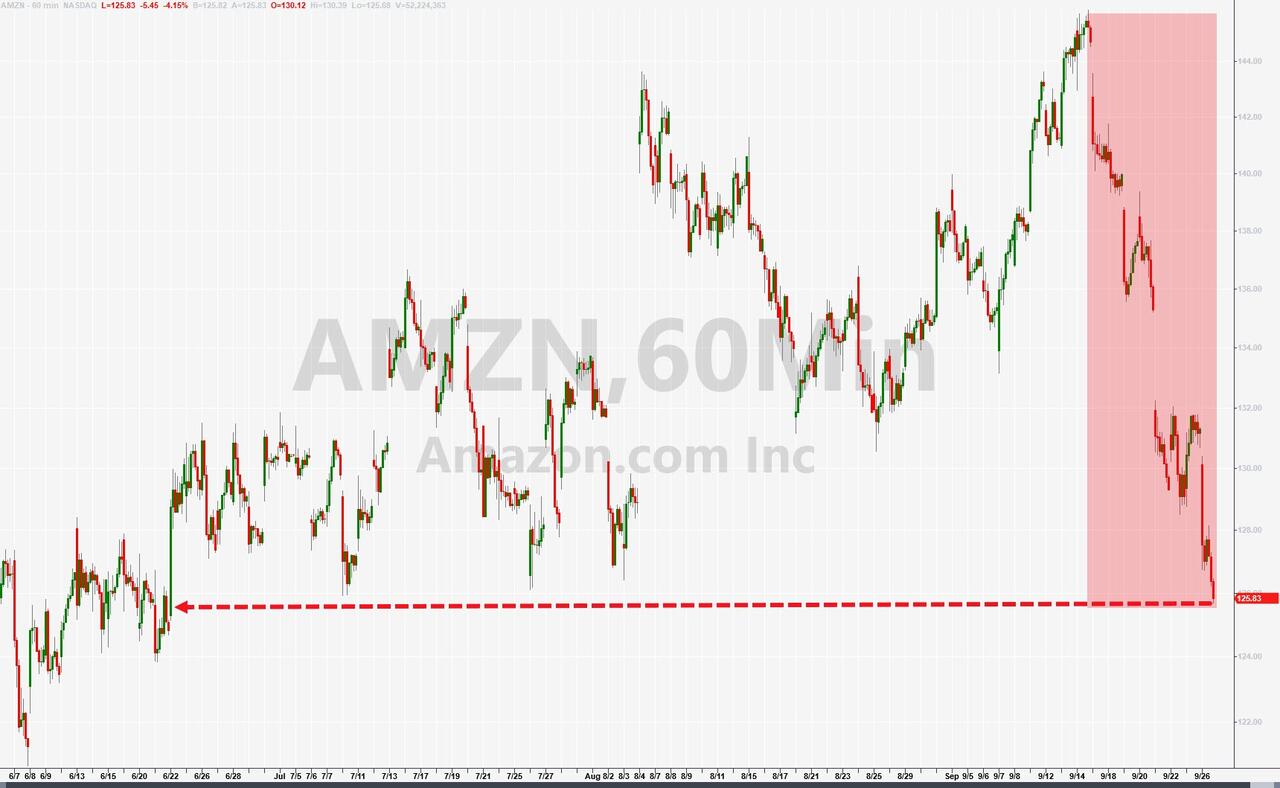
Amazon got hammered today due to the FTC suing them, hitting 3-month lows, but the whole market looked ugly. Value and Growth stocks both got hit hard, with Growth barely staying positive for the year, while Value is now down 3%.
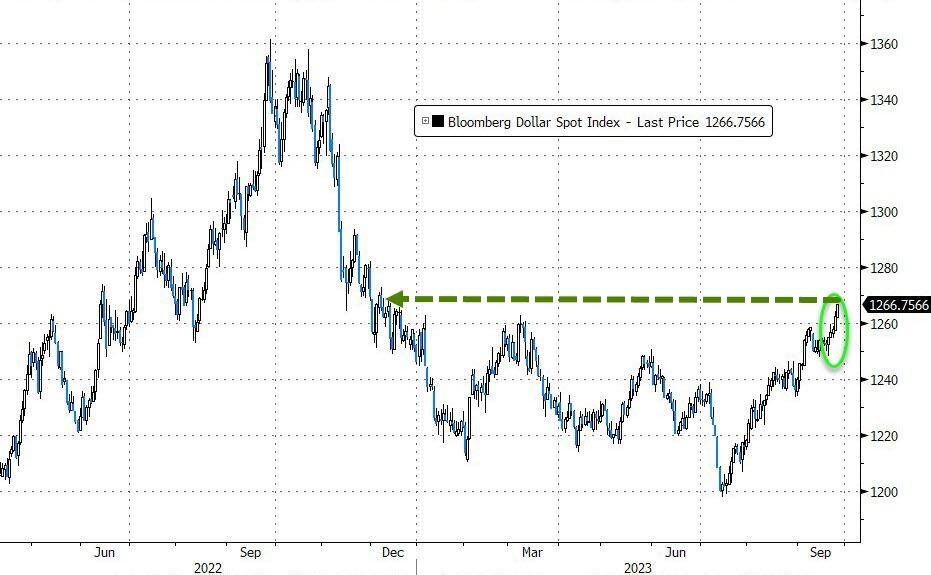
Bond yields were mixed, the dollar rallied for the fifth day in a row, which took the shine off gold, while crude oil bounced back above $90.
Finally, the Magnificent 7 stocks have lost over $1 trillion in market cap from their July highs, falling back to near 4-month lows.
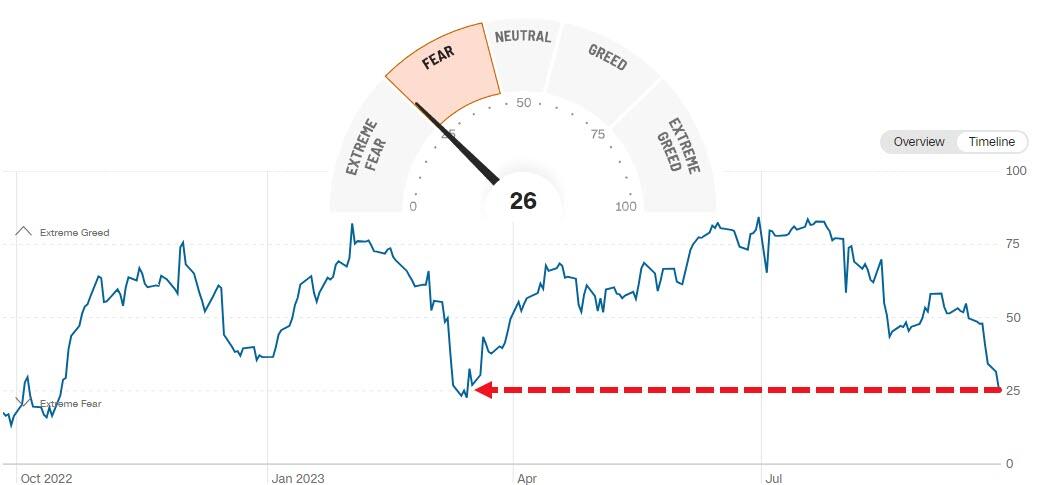
Looking at the big picture, it’s clear that we are moving from greed to fear in a hurry. That will accelerate even more once the S&P 500 drops below its 4,200 level.
Then, look out below.
2. “Buy” Cycle Suggestions
The current Buy cycle began on 12/1/2022, and I gave you some ETF tips based on my StatSheet back then. But if you joined me later, you might want to check out the latest StatSheet, which I update and post every Thursday at 6:30 pm PST.
You should also think about how much risk you can handle when picking your ETFs. If you are more cautious, you might want to go for the ones in the middle of the M-Index rankings. And if you don’t want to go all in, you can start with a 33% exposure and see how it goes.
We are in a crazy time, with the economy going downhill and some earnings taking a hit. That will eventually drag down stock prices too. So, in my advisor’s practice, we are looking for some value, growth and dividend ETFs that can weather the storm. And of course, gold is always a good friend.
Whatever you invest in, don’t forget to use a trailing sell stop of 8-12% to protect yourself from big losses.
3. Trend Tracking Indexes (TTIs)
The major indexes suffered heavy losses today, as a combination of negative news dragged down all sectors. No sector was spared.
Our TTIs continued to decline, and even the International fell slightly below its long-term trend line. This could signal the end of the “Buy” cycle, but it is not yet confirmed. In my advisor practice, we have already reduced our holdings to protect our portfolios from severe damage.
This is how we closed 09/26/2023:
Domestic TTI: -3.01% below its M/A (prior close -1.63%)—Sell signal effective 9/22/2023.
International TTI: -0.04% below its M/A (prior close +1.03%)—Buy signal effective 12/1/2022.
All linked charts above are courtesy of Bloomberg via ZeroHedge.
Contact Ulli